Firescope
USER GUIDE
Firescope User Guide
From installation to day-to-day use, read through in order and you'll be up and running. All screenshots are from the real app.
Installation
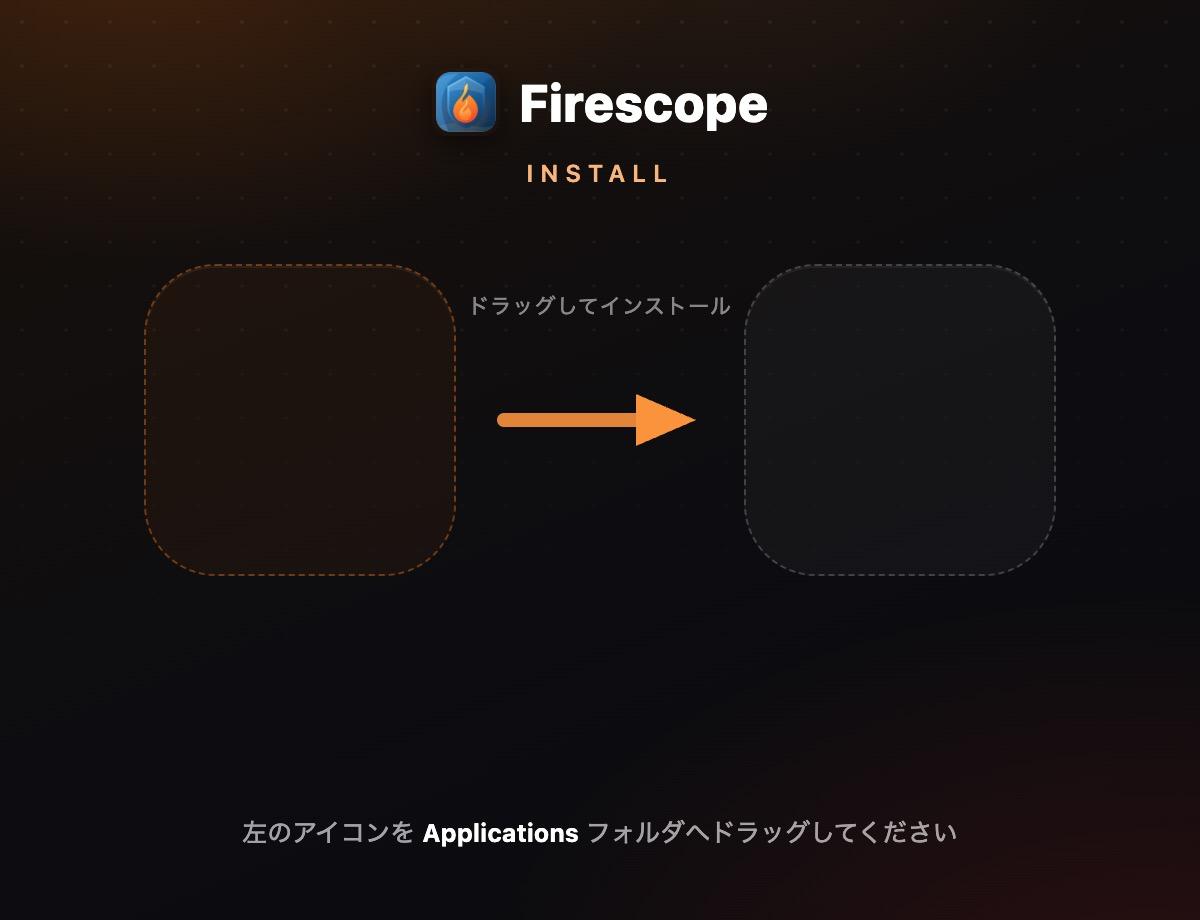
- Get the Mac
.dmgfrom the download page (Apple Silicon or Intel). - Open the downloaded
.dmgand drag the Firescope icon into the Applications folder. - Launch Firescope from the Applications folder.
Windows
- Get
Firescope-Setup.exefrom the download page and run it. - If SmartScreen warns you on first run, click "More info" → "Run anyway" to continue.
Initial setup (language and theme)
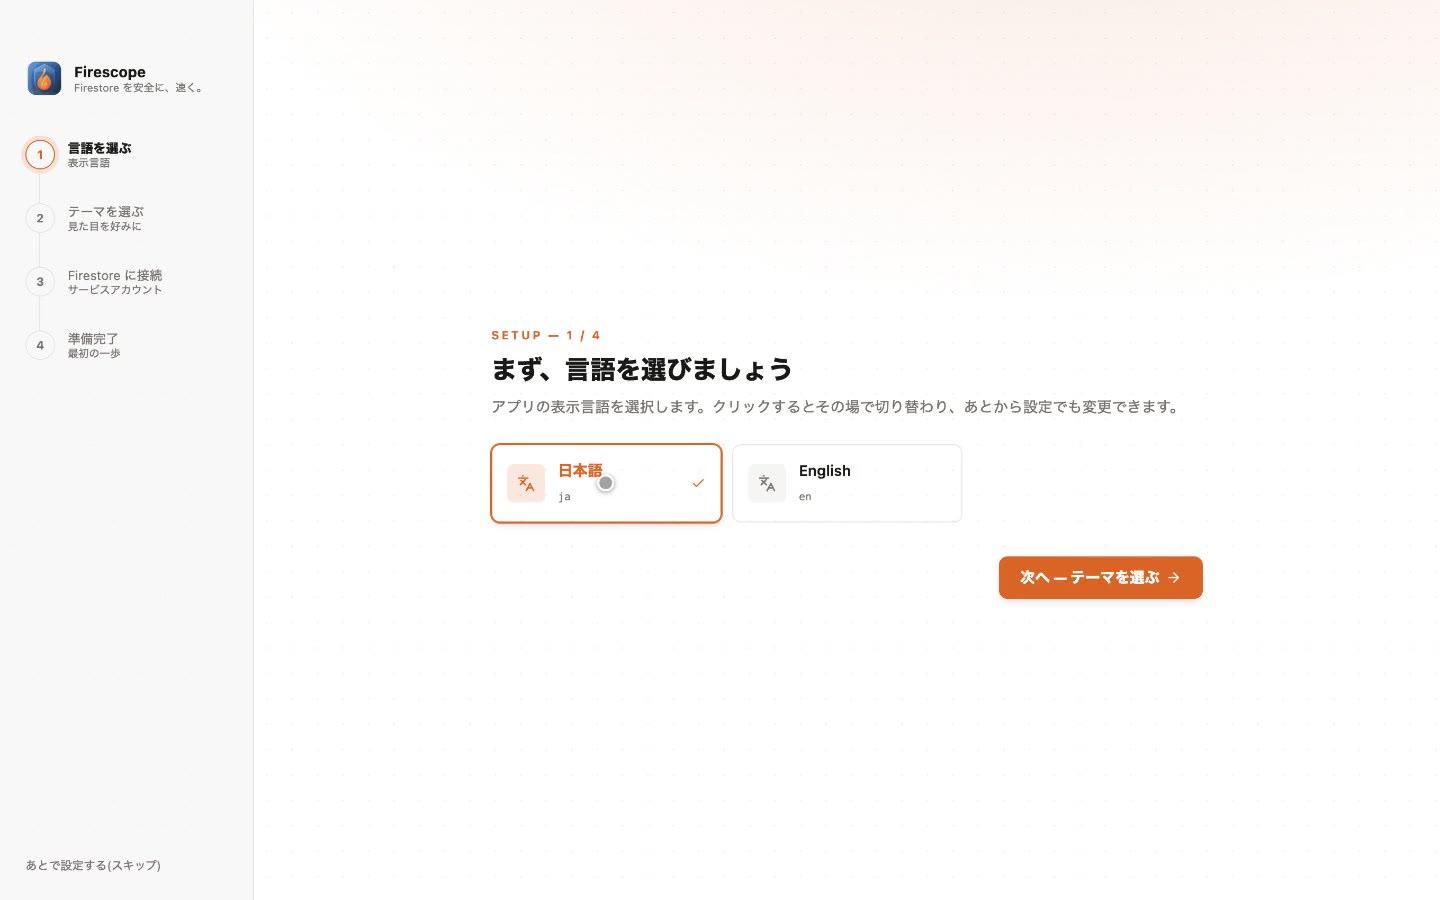
On first launch, a 4-step setup screen opens. Start by choosing the display language (9 languages built in: Japanese, English, Simplified Chinese, Traditional Chinese, Korean, Spanish, Portuguese, French, German). The change applies instantly as you click, so try each one if you're unsure.
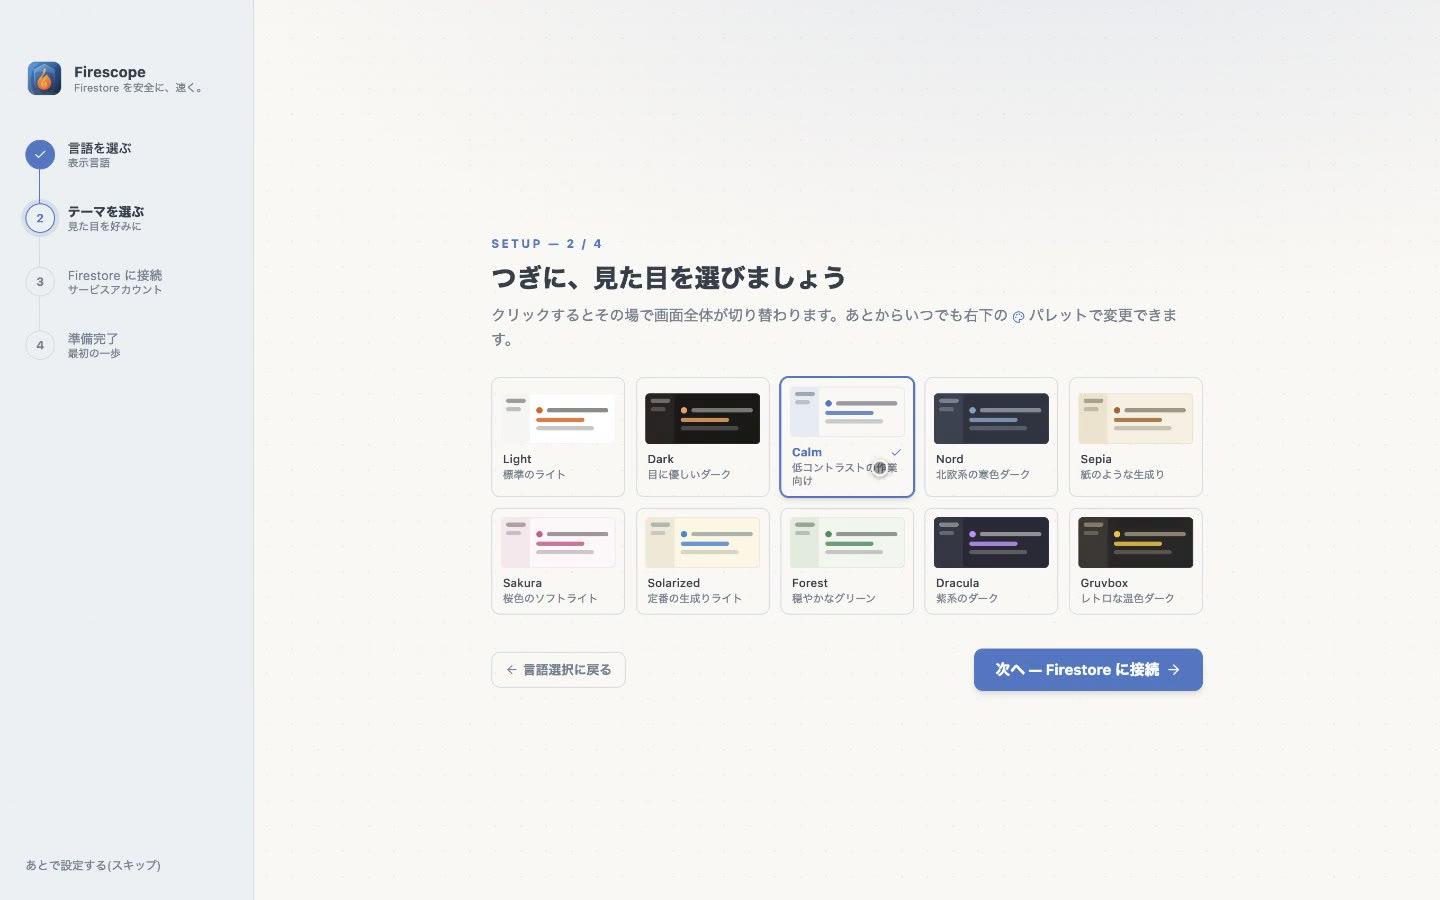
Next, choose a visual theme — 10 options including Light and Dark. Clicking a theme previews it instantly.
Connecting to Firestore
There are two ways to connect. The easier one is signing in with your Google account, which needs no key file at all. You can also connect the traditional way, with a service account private key (JSON).
Option 1: Sign in with your Google account
Authenticate Firescope with the Google account you already use, then simply pick from the list of Firebase projects you have access to. There is no key file to download and nothing to keep safe.
- On the "Google" tab of the Add connection dialog, click "Sign in with Google" to open the consent screen in your browser.
- Back in the app, every Firebase project you can access is listed. Narrow the list by searching, or use "Select all N shown" to pick them in bulk. Projects you have already connected cannot be selected— they are marked "Connected" to prevent duplicates.
- For each project you selected, set an environment label and whether it is read-only. The environment label is inferred automatically from the project ID, so you only need to correct the ones that are wrong.
- Click "Add N connections" to finish.
Option 2: Use a service account private key (JSON)
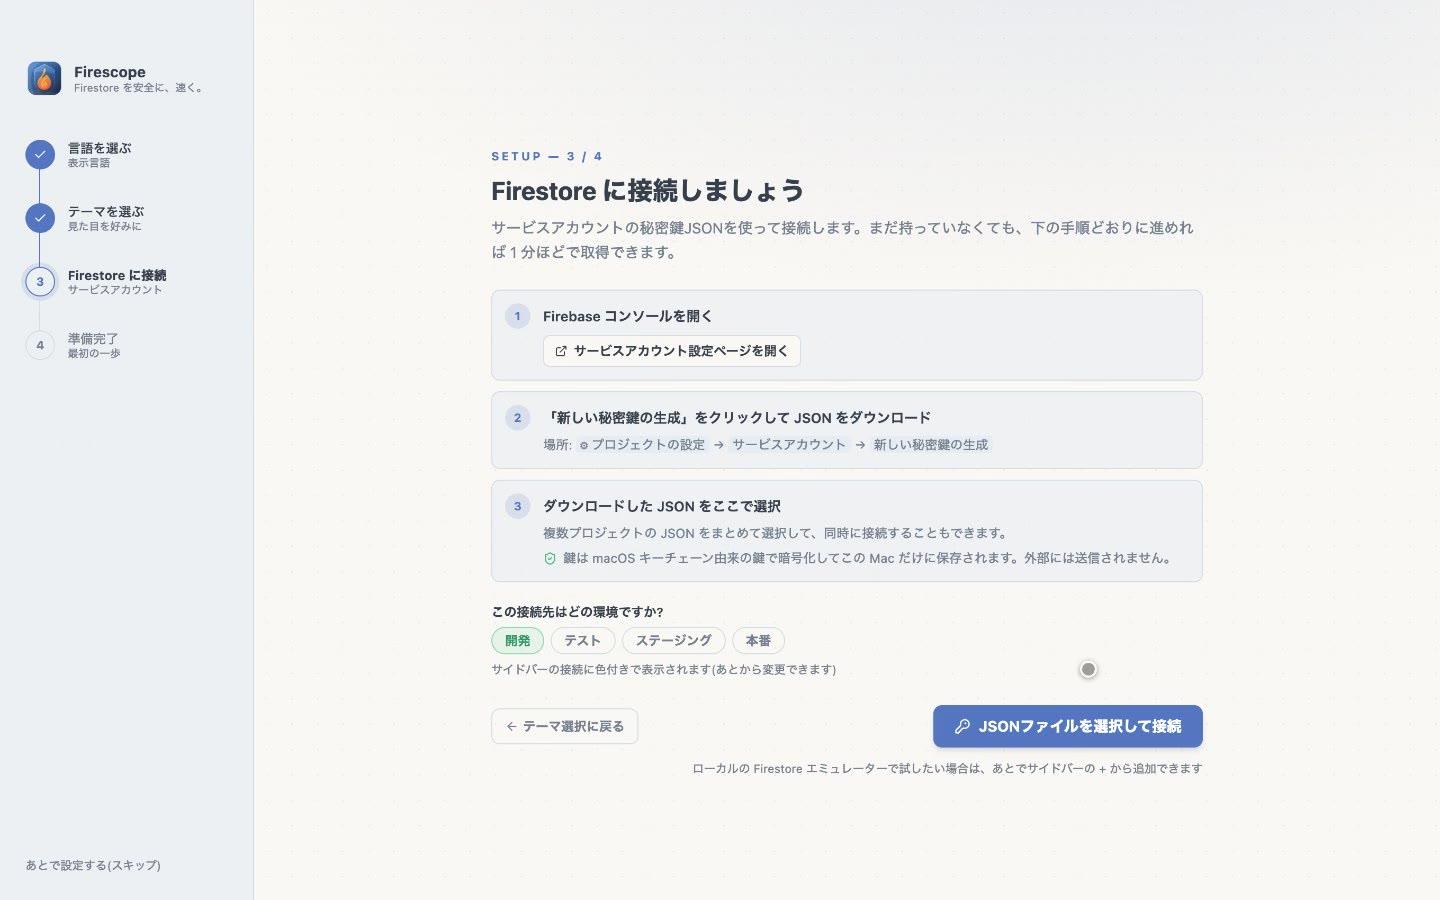
Choose this if you want to use a CI service account, or connect without a Google account. If you don't have a key yet, following the on-screen guide takes about a minute.
- Click "Open service account settings page" to open the relevant page in the Firebase console in your browser (Project settings → Service accounts).
- Click "Generate new private key" to download the JSON file.
- Back in Firescope, choose the downloaded JSON from "Select JSON file to connect". You can also select JSON files for multiple projects at once to connect to them all simultaneously.
- Choose the target environment (Development / Test / Staging / Production). It is shown as a colored label in the sidebar, and the strength of the safety guard is determined by this label.
Organizing connections (groups and hiding)
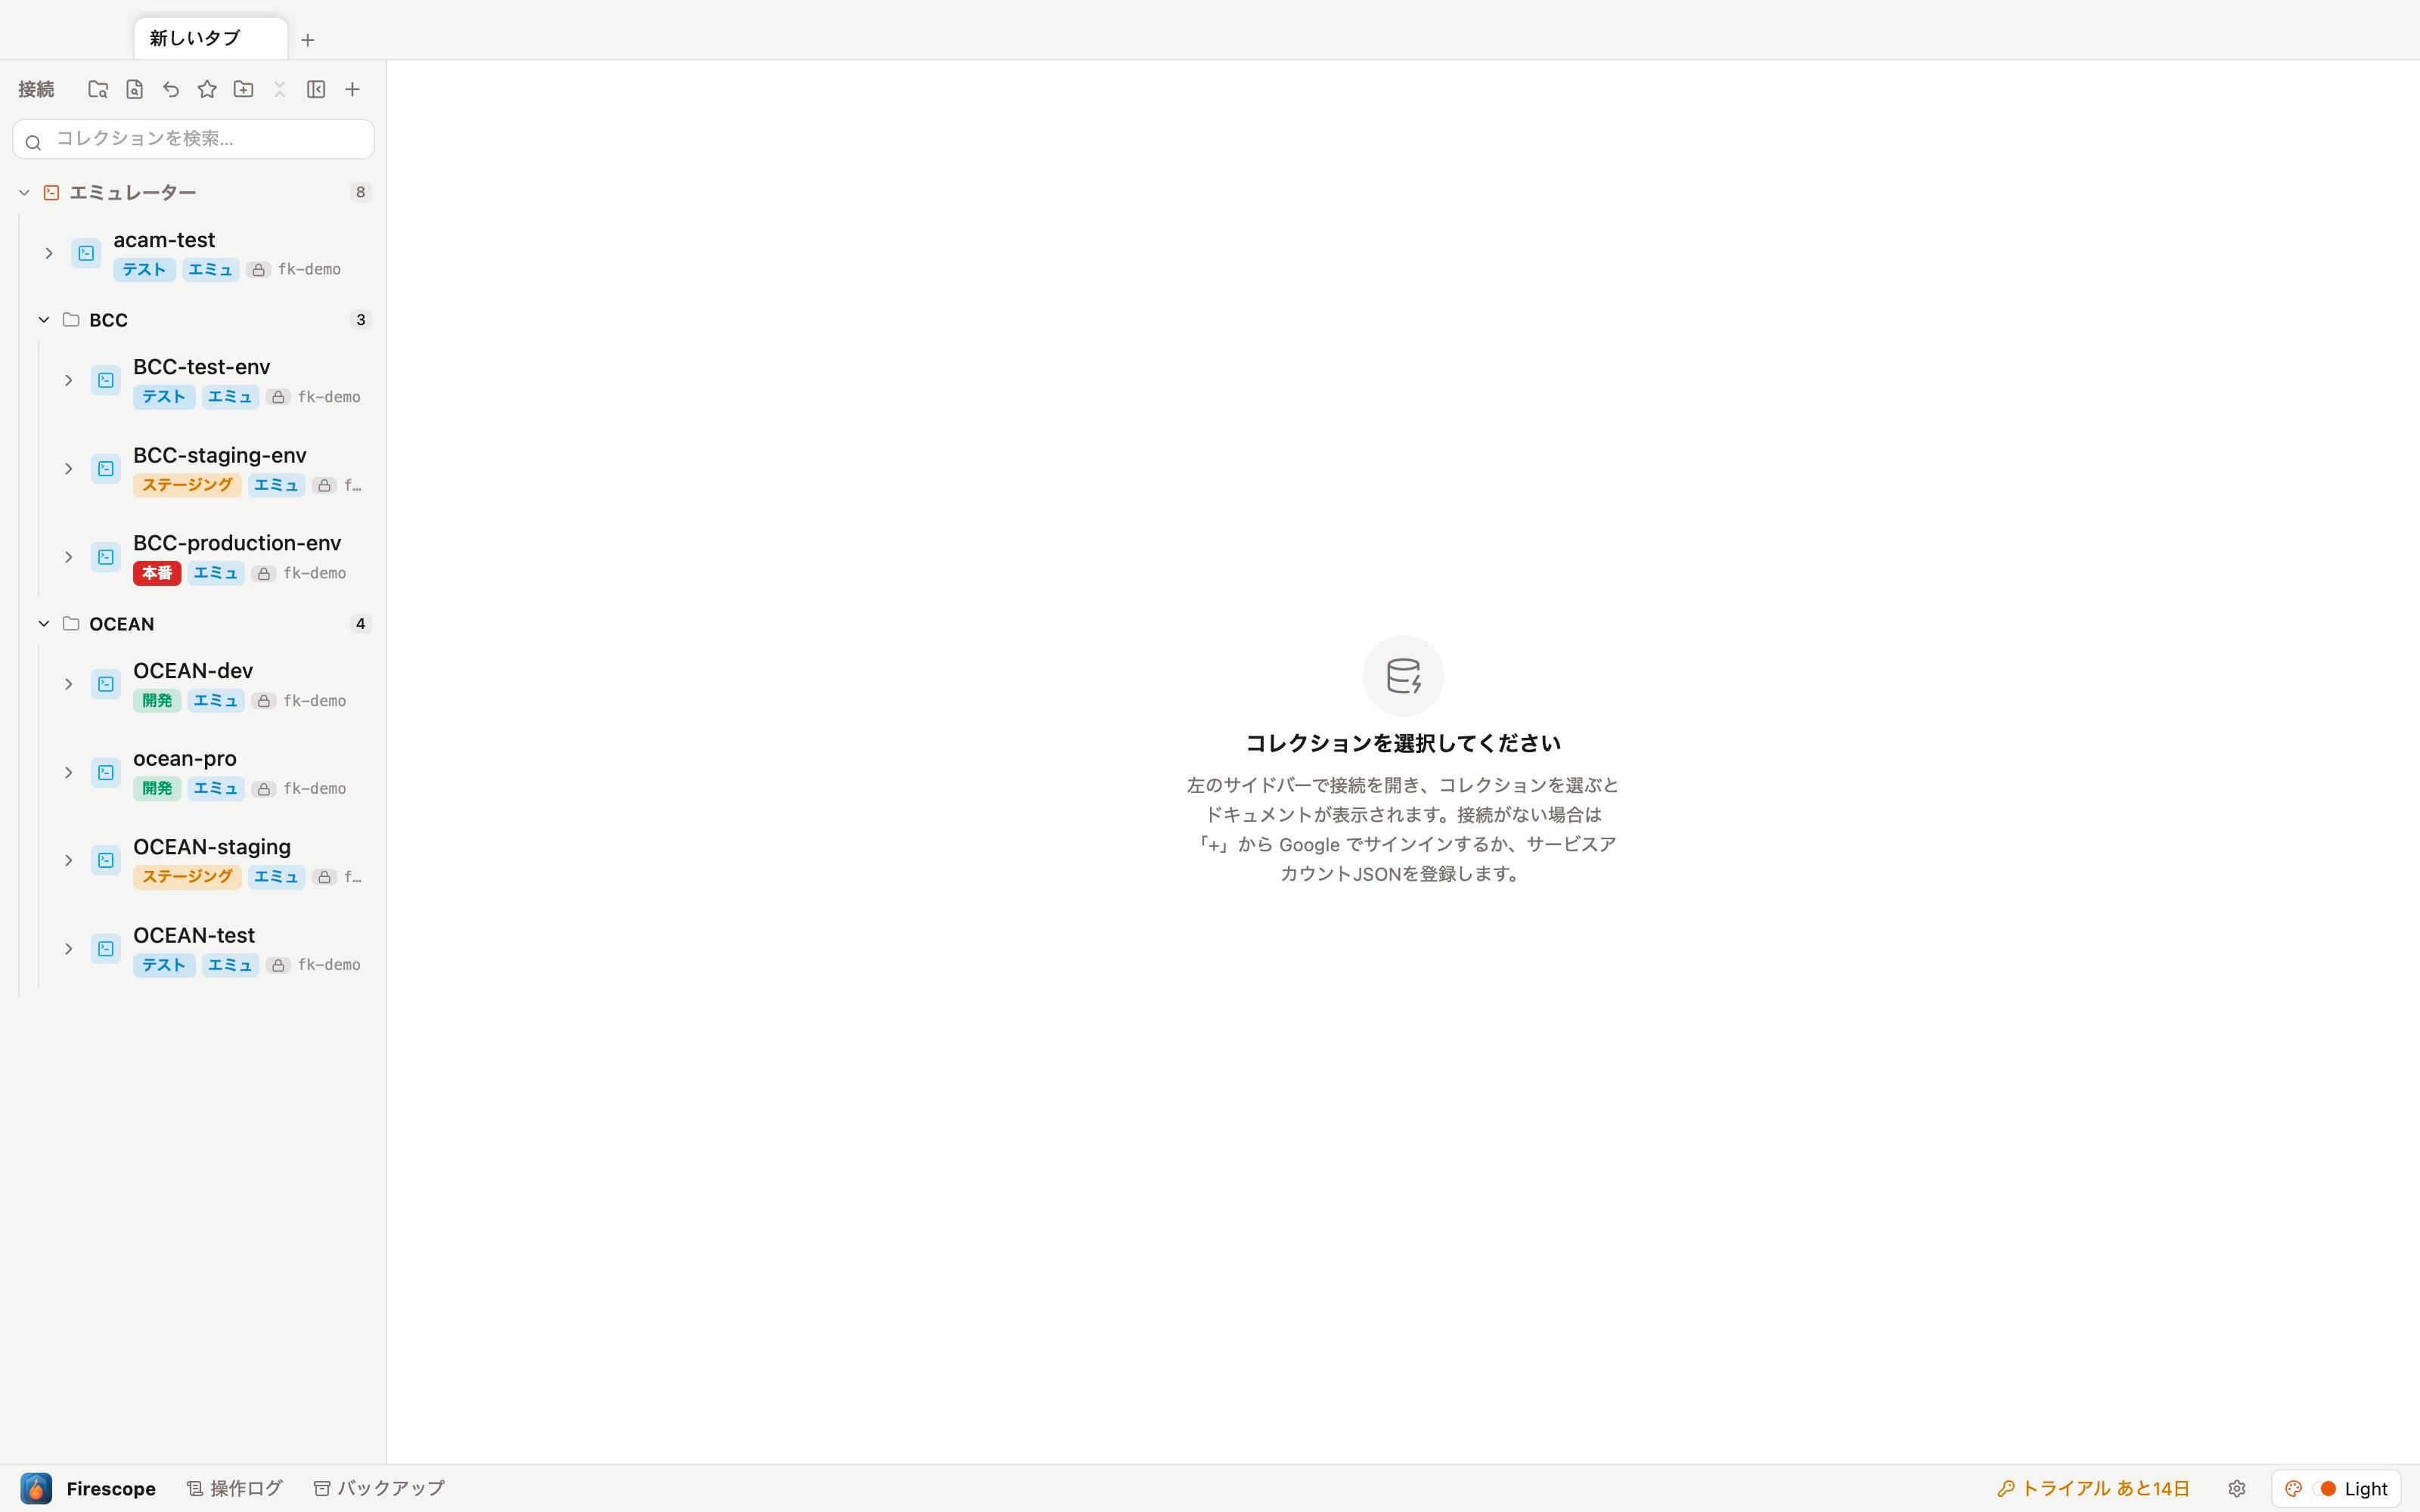
As connections pile up, it gets hard to tell which sidebar entry is which project. Firescope adds headings and organizes them for you, with nothing to rearrange.
Automatic grouping
Connections are divided first by the credential they connect with.
- Google account — one section per signed-in account. Even if you switch between several accounts, you can see at a glance which one a connection came from
- Admin SDK key — one per service account private key
- Emulator — connections to a local Firestore emulator
Within each section, connections are then grouped by the common part of their names. Trailing words that denote an environment — dev / staging / production / test / env — are stripped before matching, so OCEAN-dev, ocean-pro, OCEAN-staging, and OCEAN-test all collapse under a single OCEAN heading (matching is case-insensitive).
Hiding connections you don't use
You can hide a connection from the list without disconnecting it. Its settings and keys are kept, so you can bring it back at any time.
- Right-click a connection → "Hide this connection". From a group heading you get "Hide this group", and from a multiple selection (⌘ / Shift click) you get "Hide selected connections".
- While anything is hidden, an eye icon with a count badge appears at the top of the sidebar.
- Click that icon to show hidden connections, dimmed. Right-click → "Show again" restores them. You can also restore a whole group or a multiple selection at once.
Browsing data
Open a connection in the sidebar and click a collection to display its documents in a table. Each column header shows a type badge (string / int / time, etc.) so you can see the shape of the data at a glance.
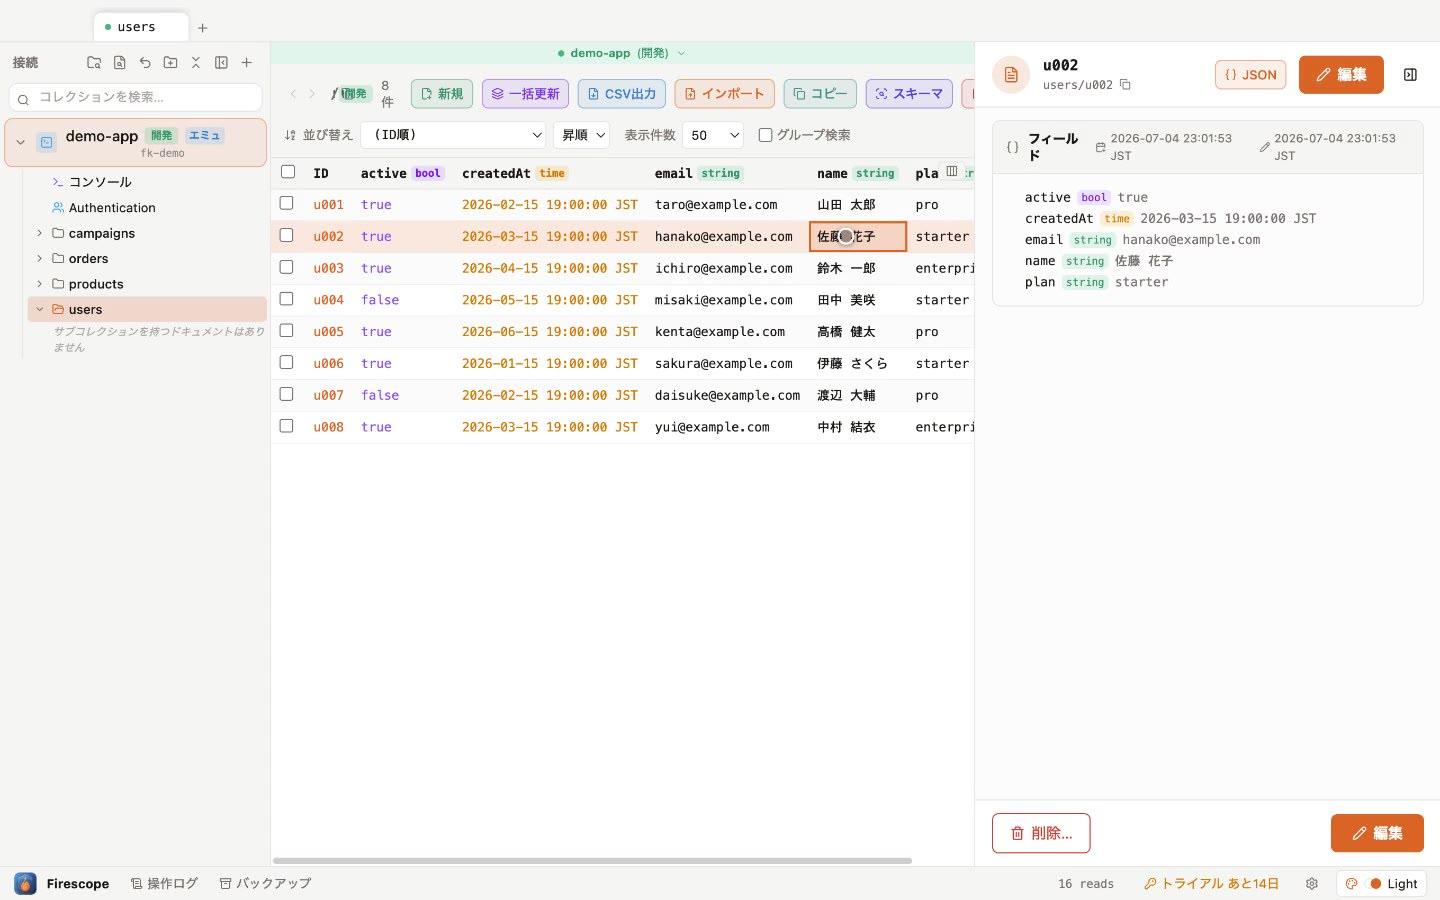
- Click a row to show all of the document's fields in the right-hand panel.
- Sorting, page size, and collection group search can all be changed from the toolbar.
- The read count is always shown in the status bar, as a gauge of billing usage.
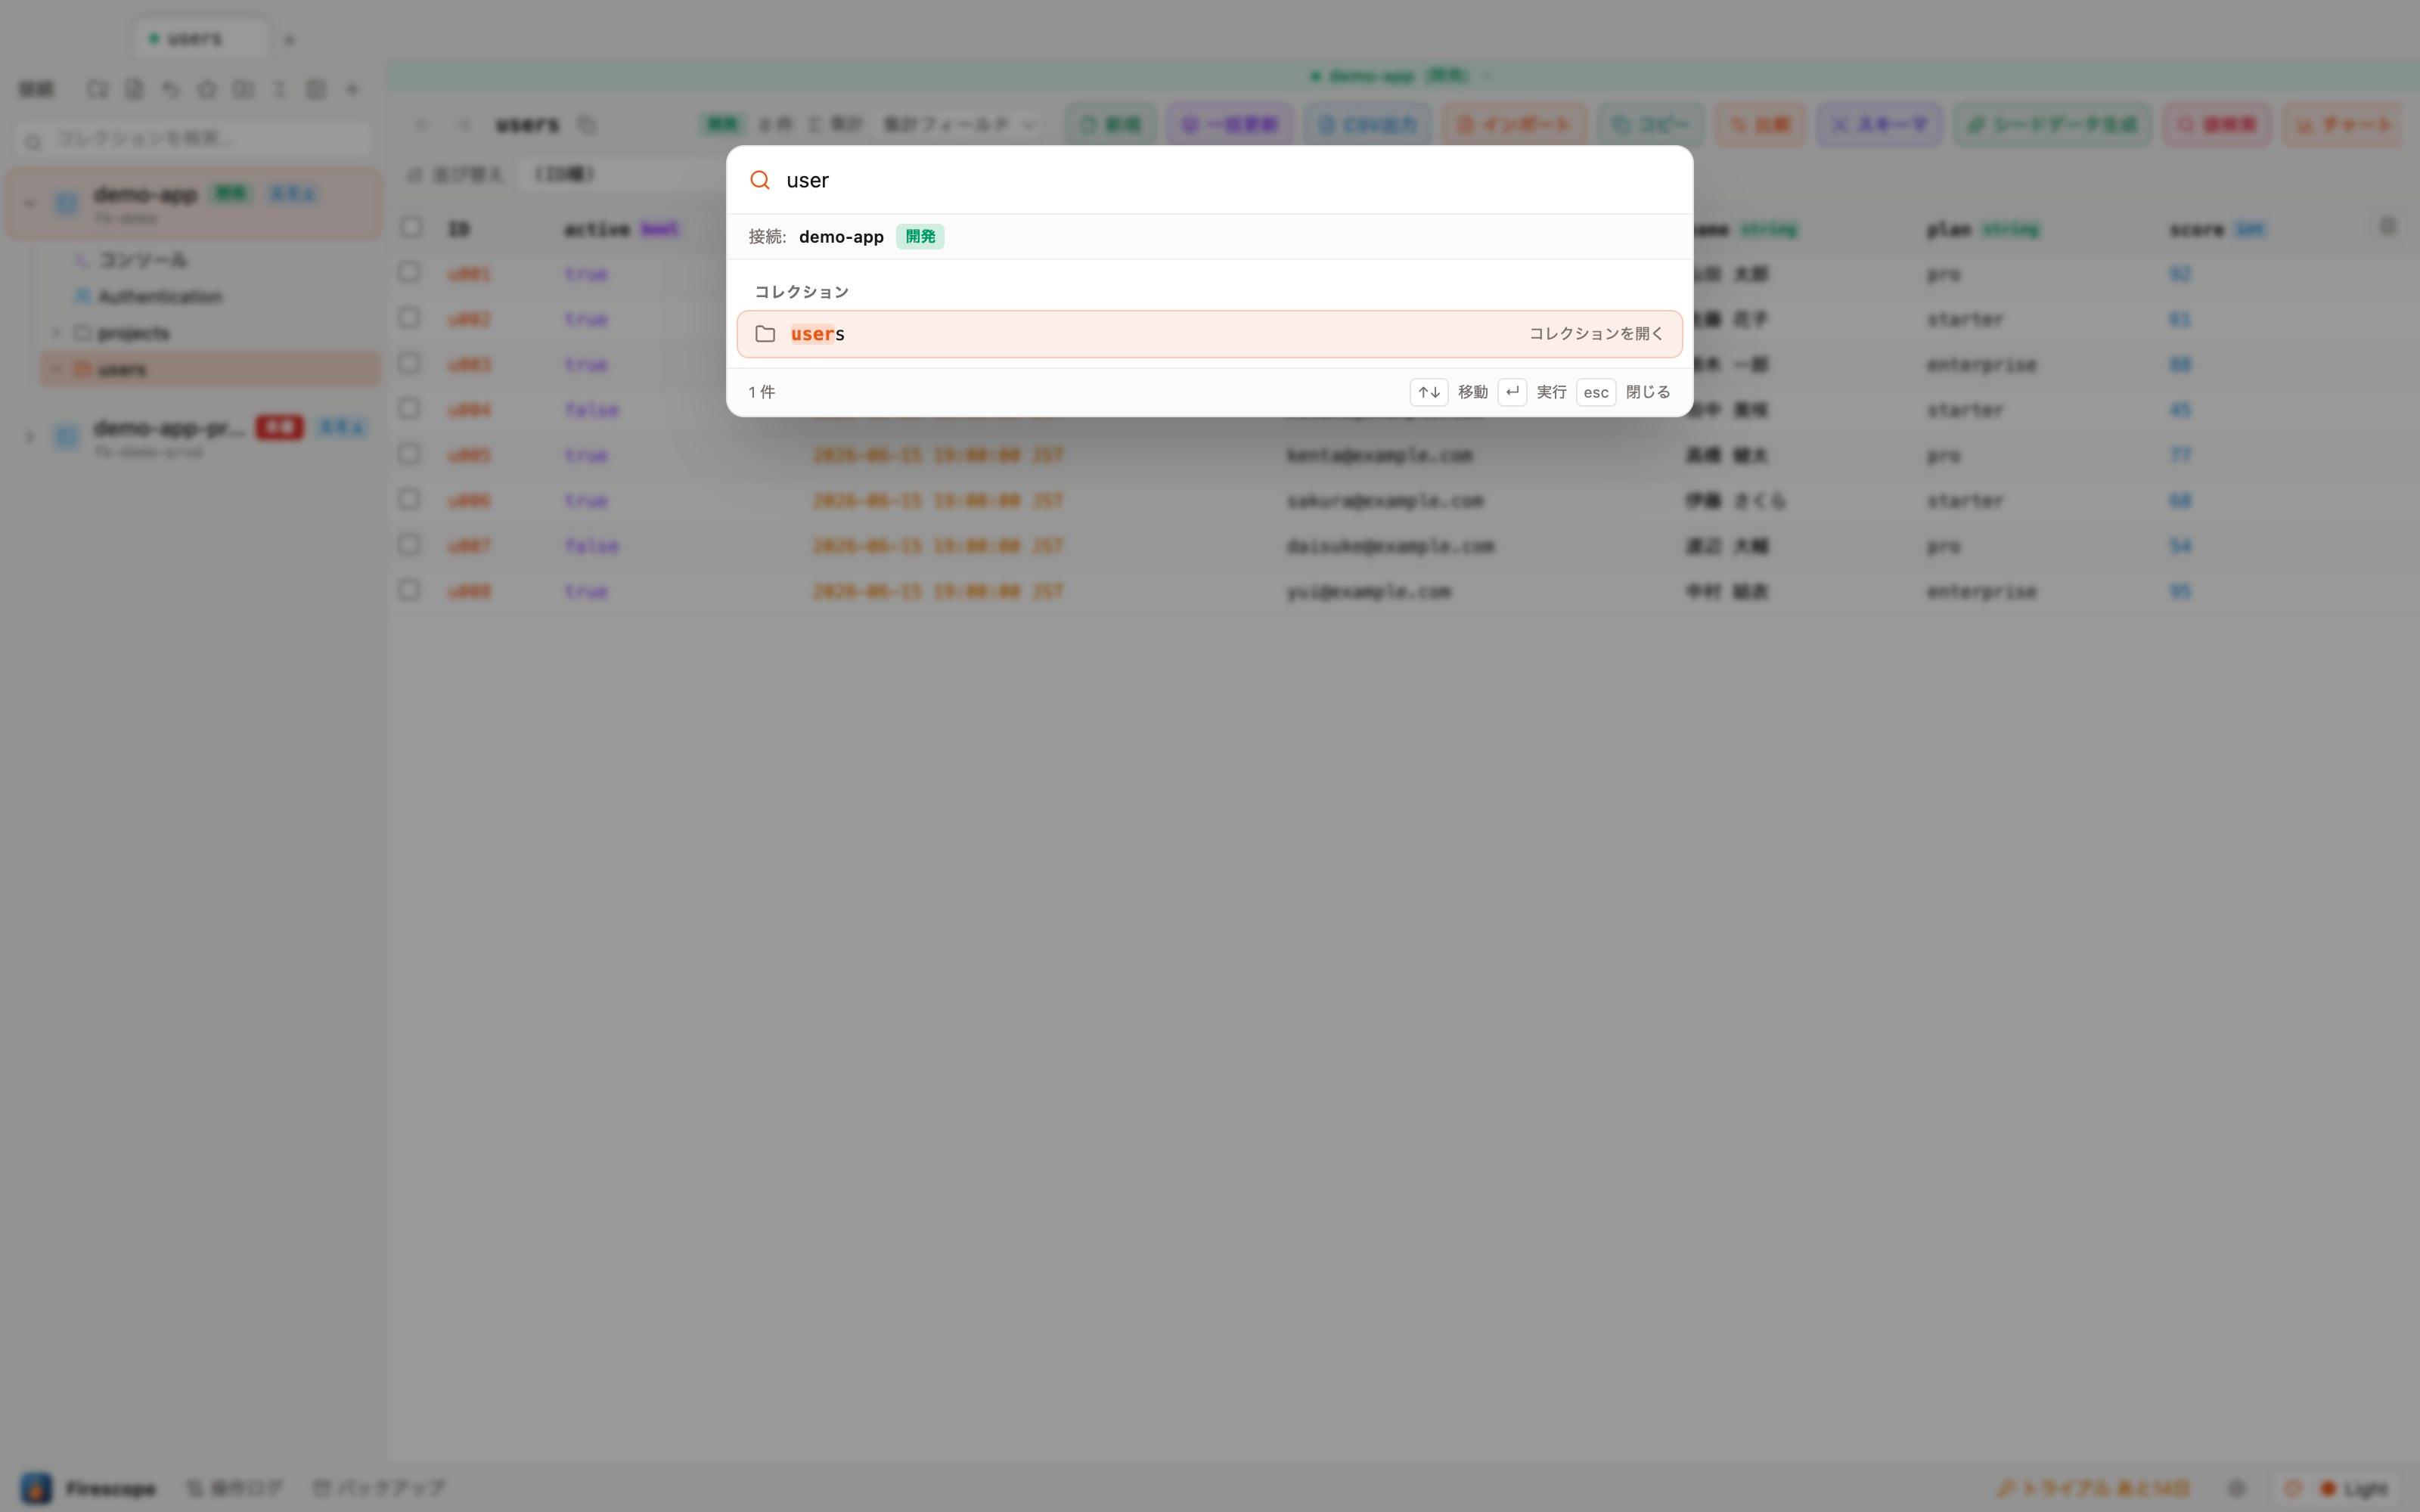
⌘P jump to a collection by name
⌘K search across documents by ID
⌘F search inside the table (in-table search)
⌘⇧F focus the sidebar collection search
Command palette (⌘K)
⌘K brings up a cross-app search from anywhere. It searches collection names, connection names, screens, and your "recently viewed"/bookmarks all at once, and if you type 6 or more characters it also searches across documents by ID.
- Use ↑↓ to move between candidates and Enter to run one — switch screens without reaching for the mouse.
- Frequently used actions like switching themes, toggling value masking, and opening settings or the shortcut list are also available here.
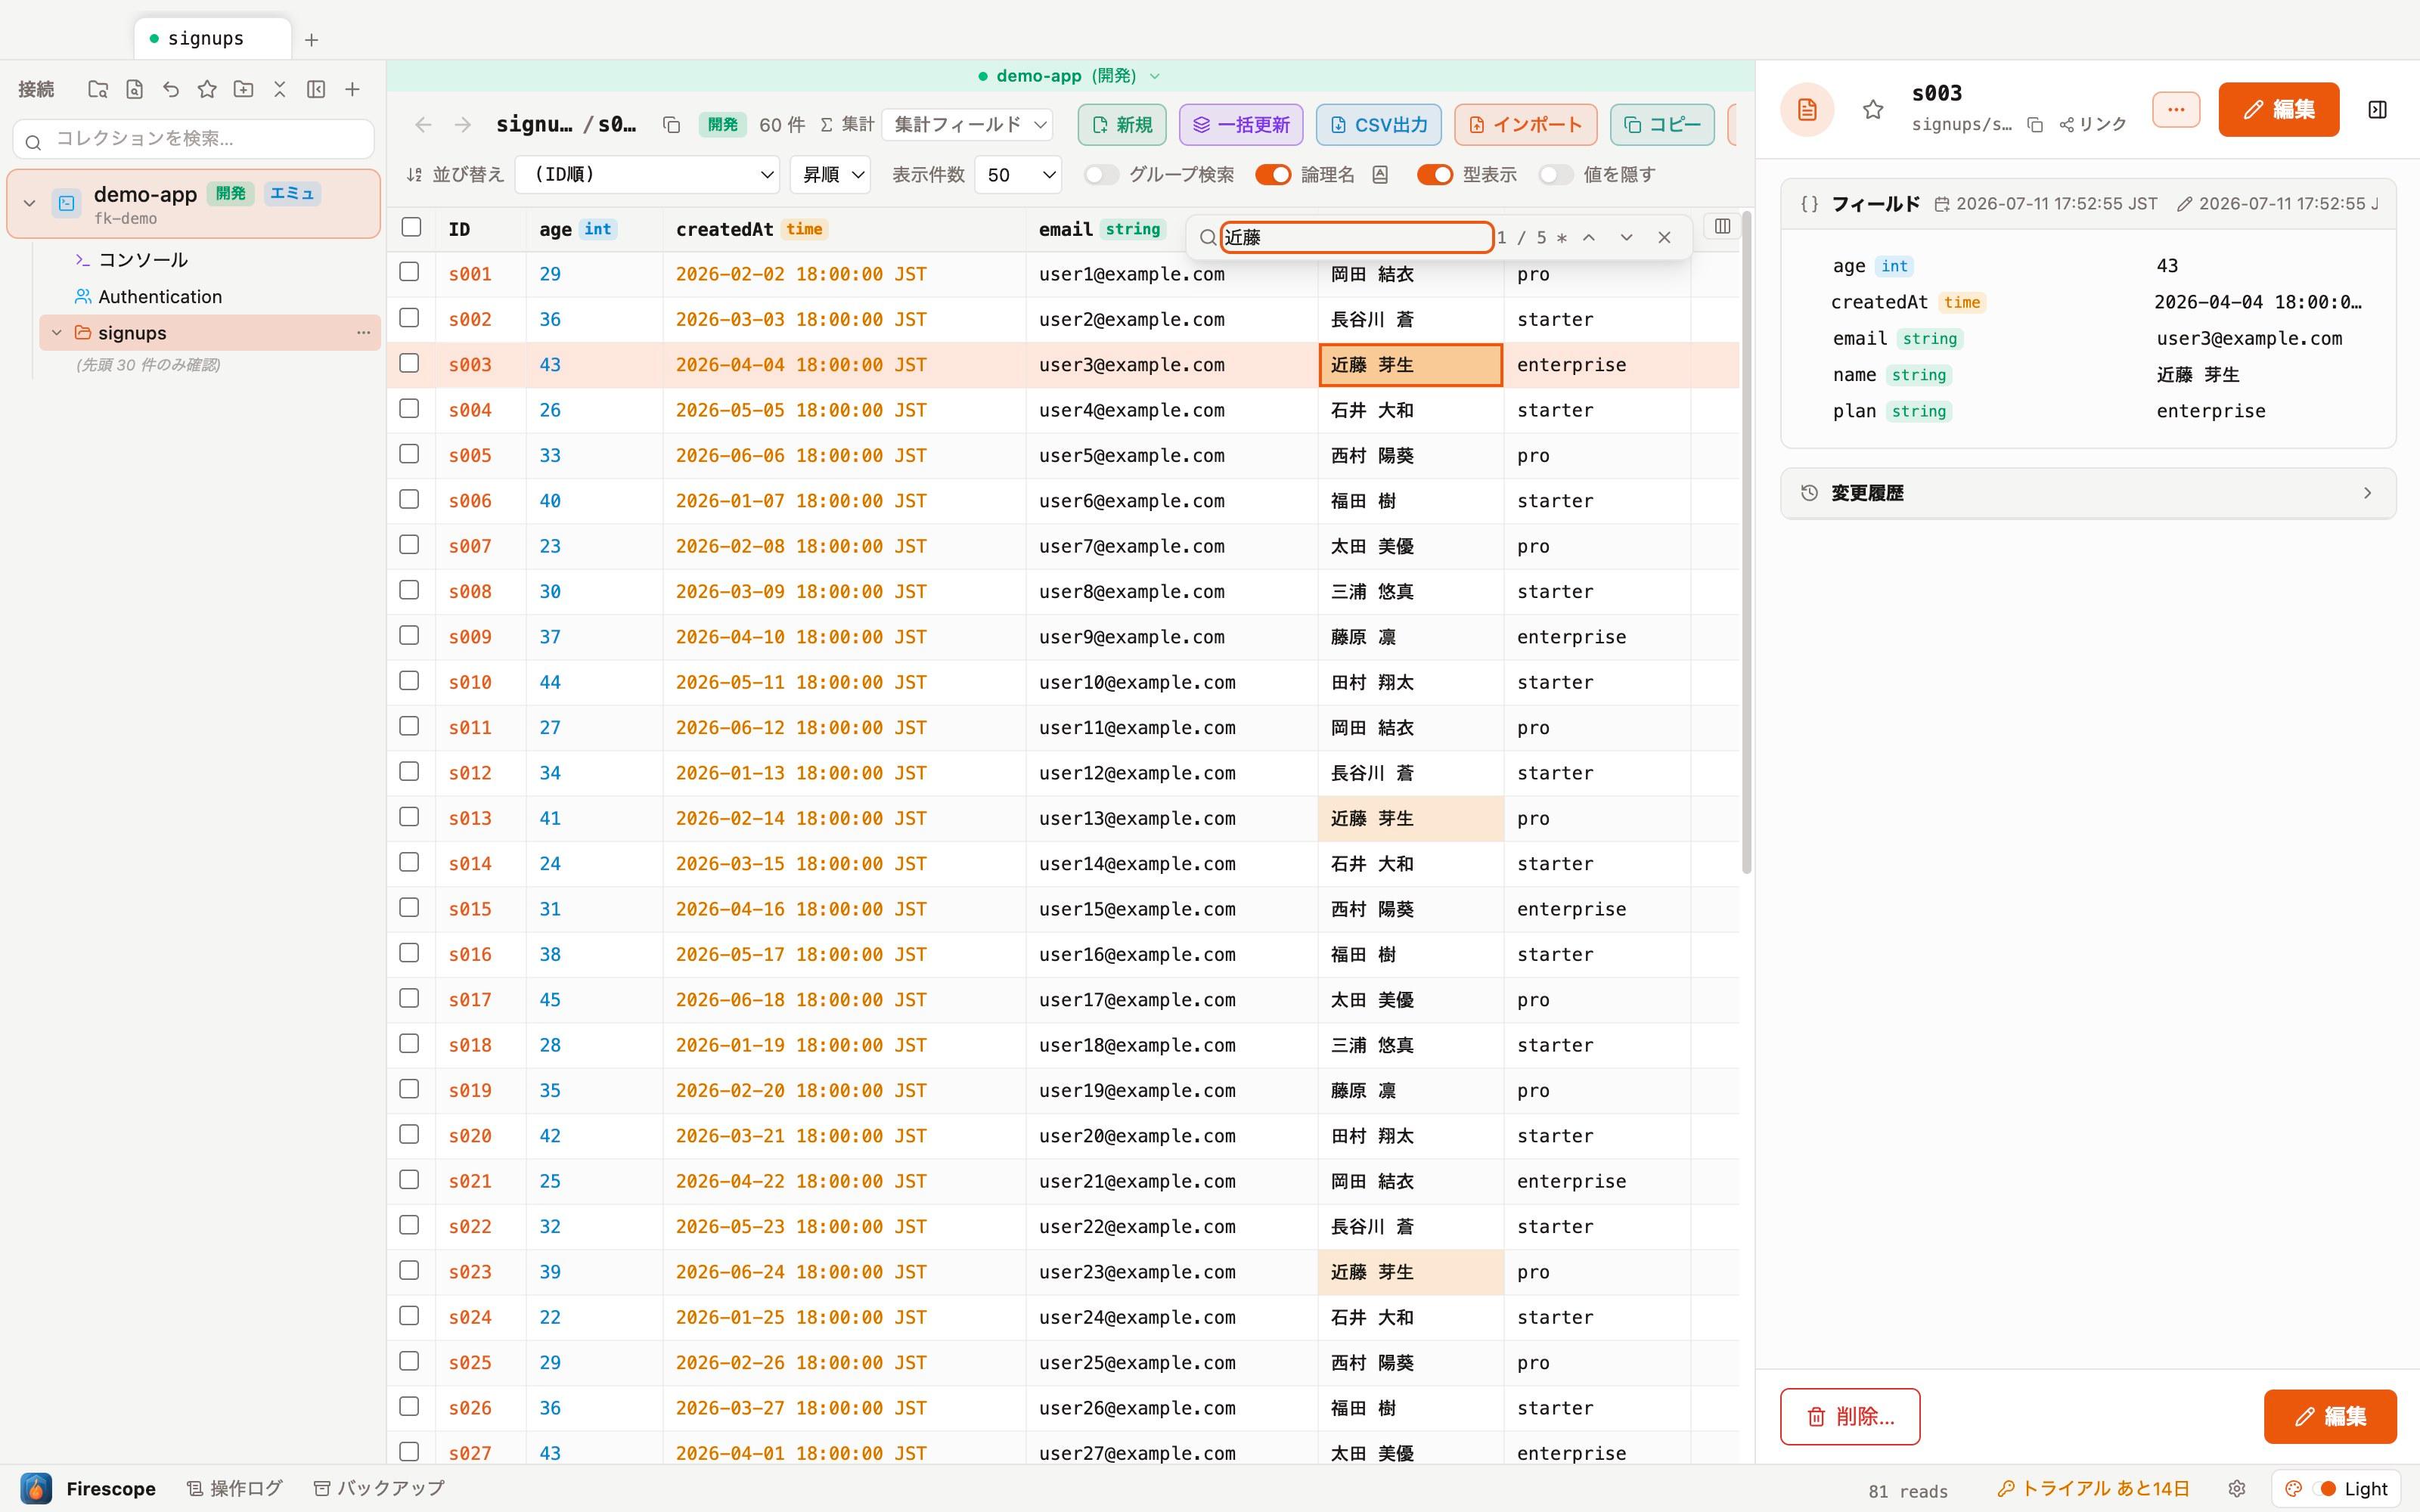
In-table search (⌘F)
With a table open, press ⌘F (Ctrl+F on Windows) to run a case-insensitive substring search across every cell. Hits are highlighted in amber, and each press of Enter glides the cursor to the next hit with a smooth scroll.
- Searches every visible column, including the ID column.
- Enter for the next hit, Shift+Enter for the previous one — it wraps around at the end.
- The found cell becomes the selected cell, so you can keep going with the arrow keys, ⌘C, or F2 to edit.
- Before all documents are loaded, only the loaded range is searched (an * appears next to the hit count).
- The sidebar collection search moved to ⌘⇧F (on screens without a table, plain ⌘F still focuses it).
Query power tools
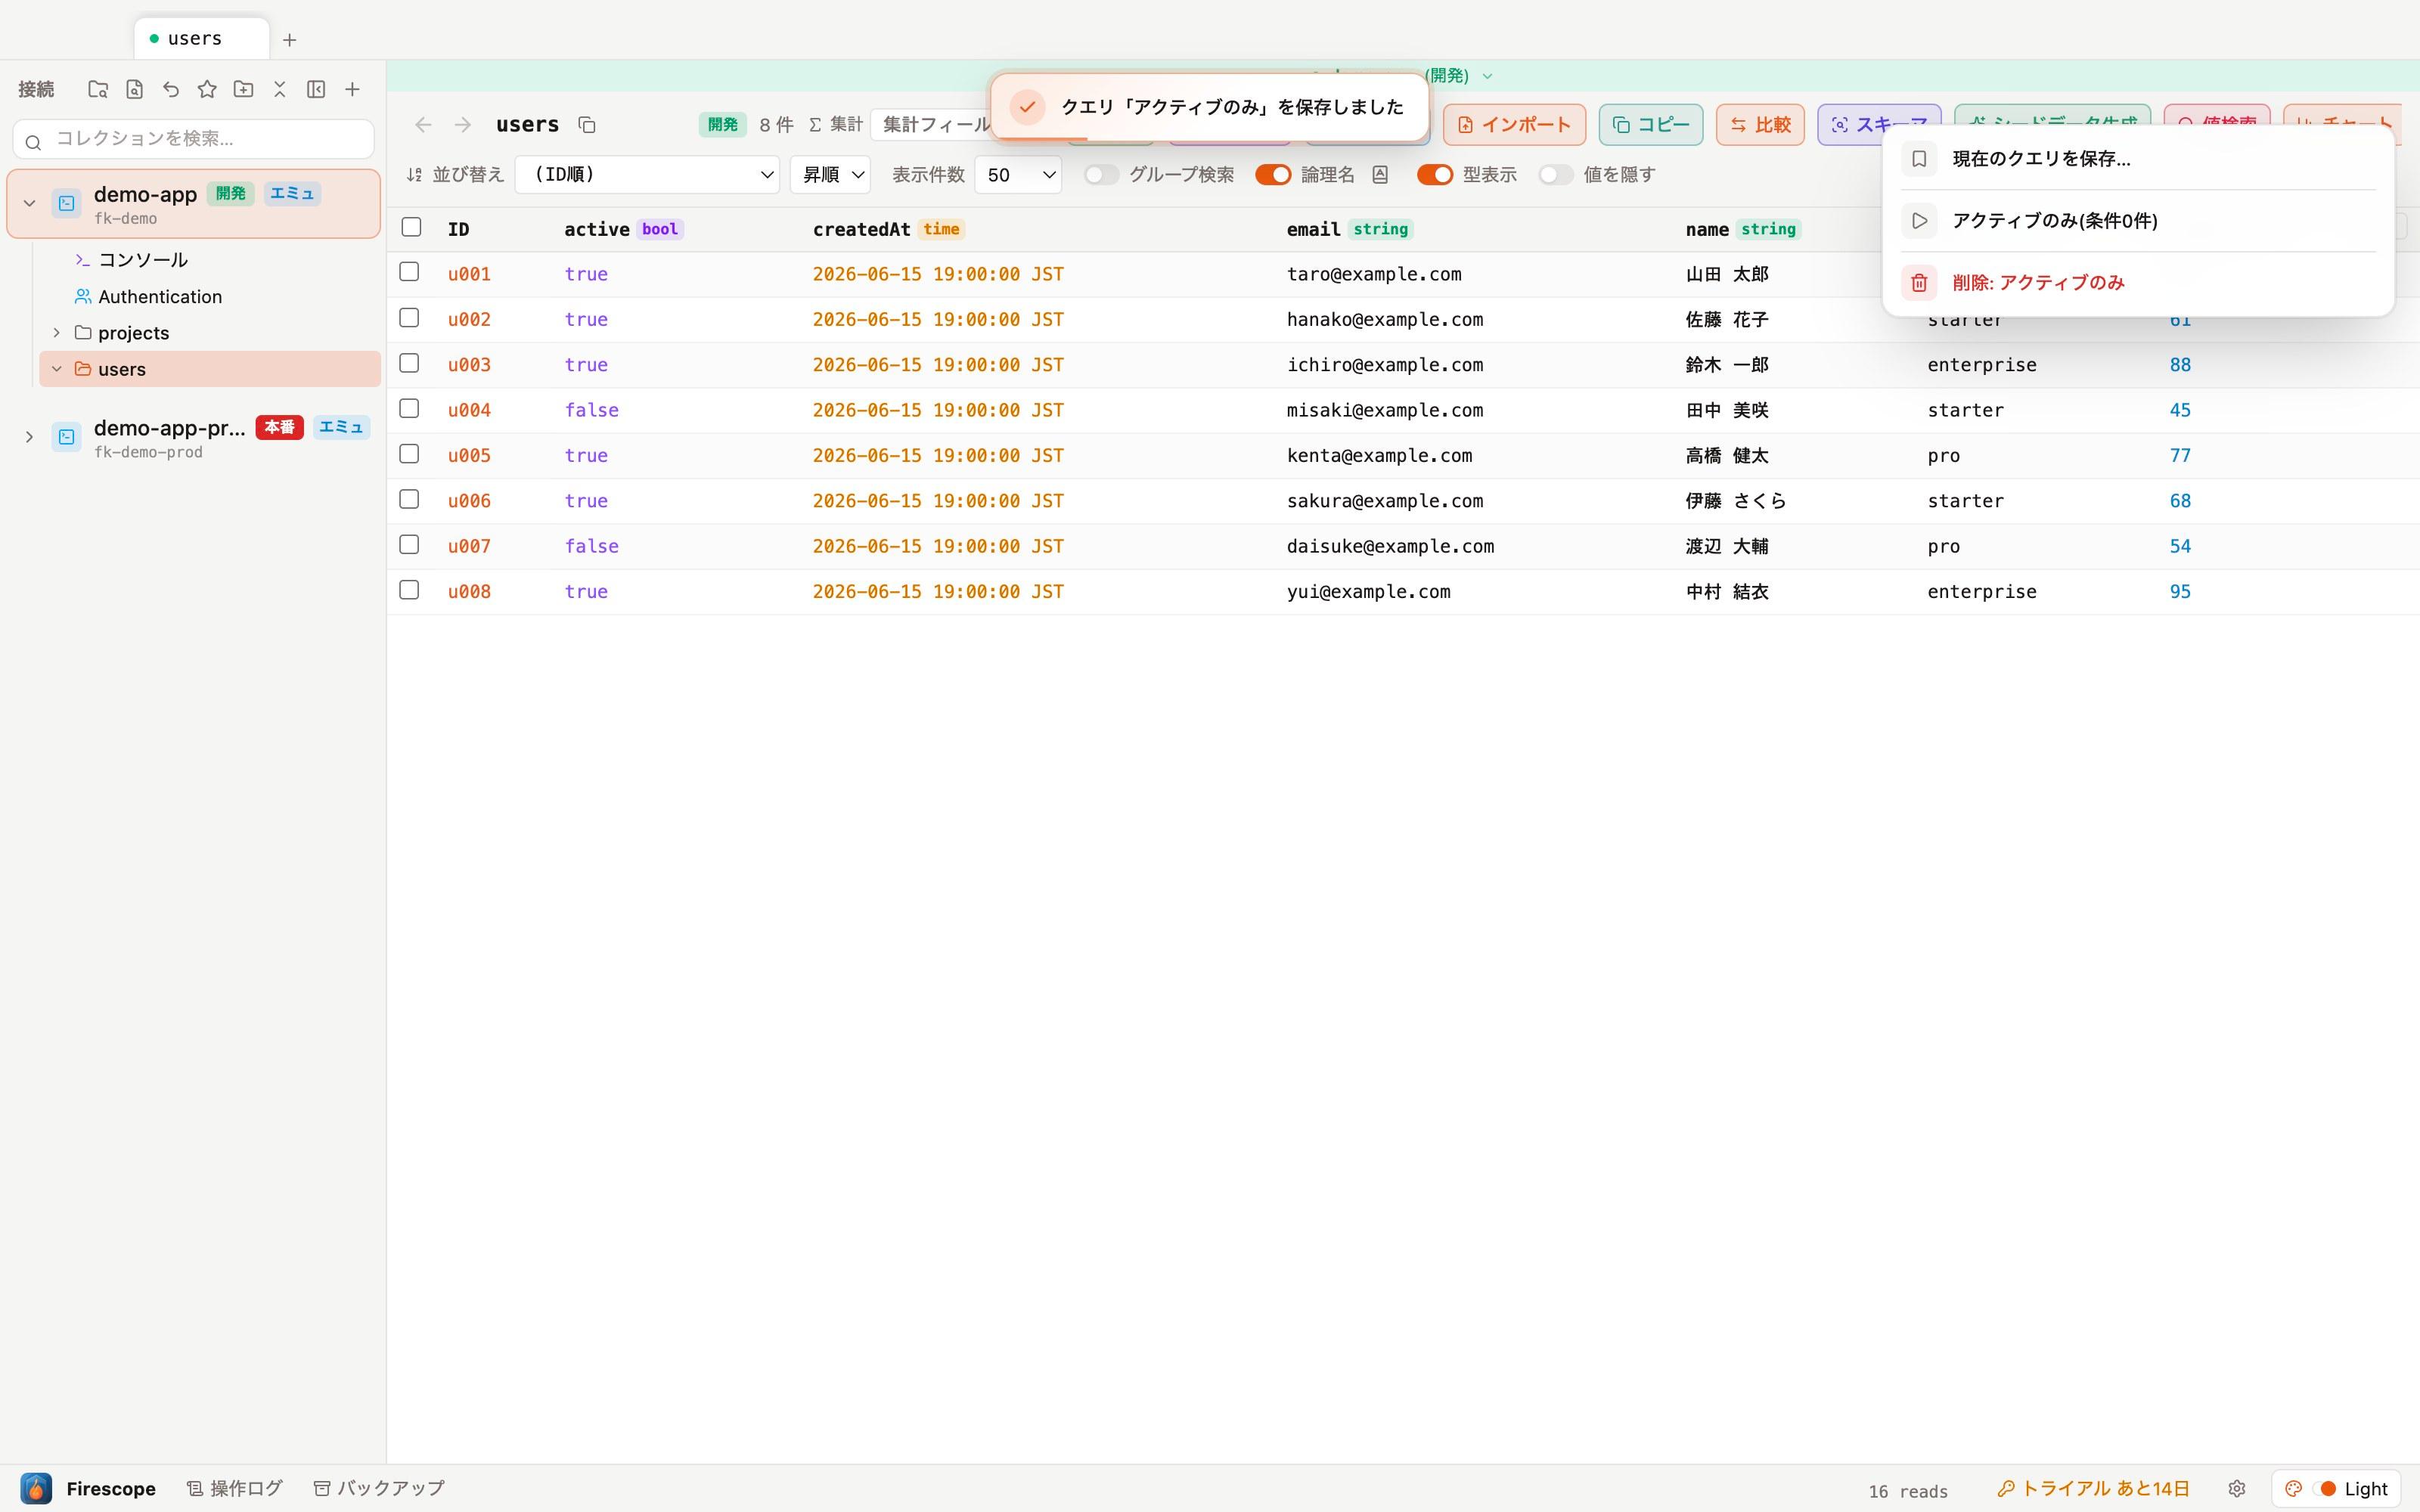
A query you've built can be saved as a saved query under a name and recalled from a list at any time (conditions, sort order, and count are all restored together).
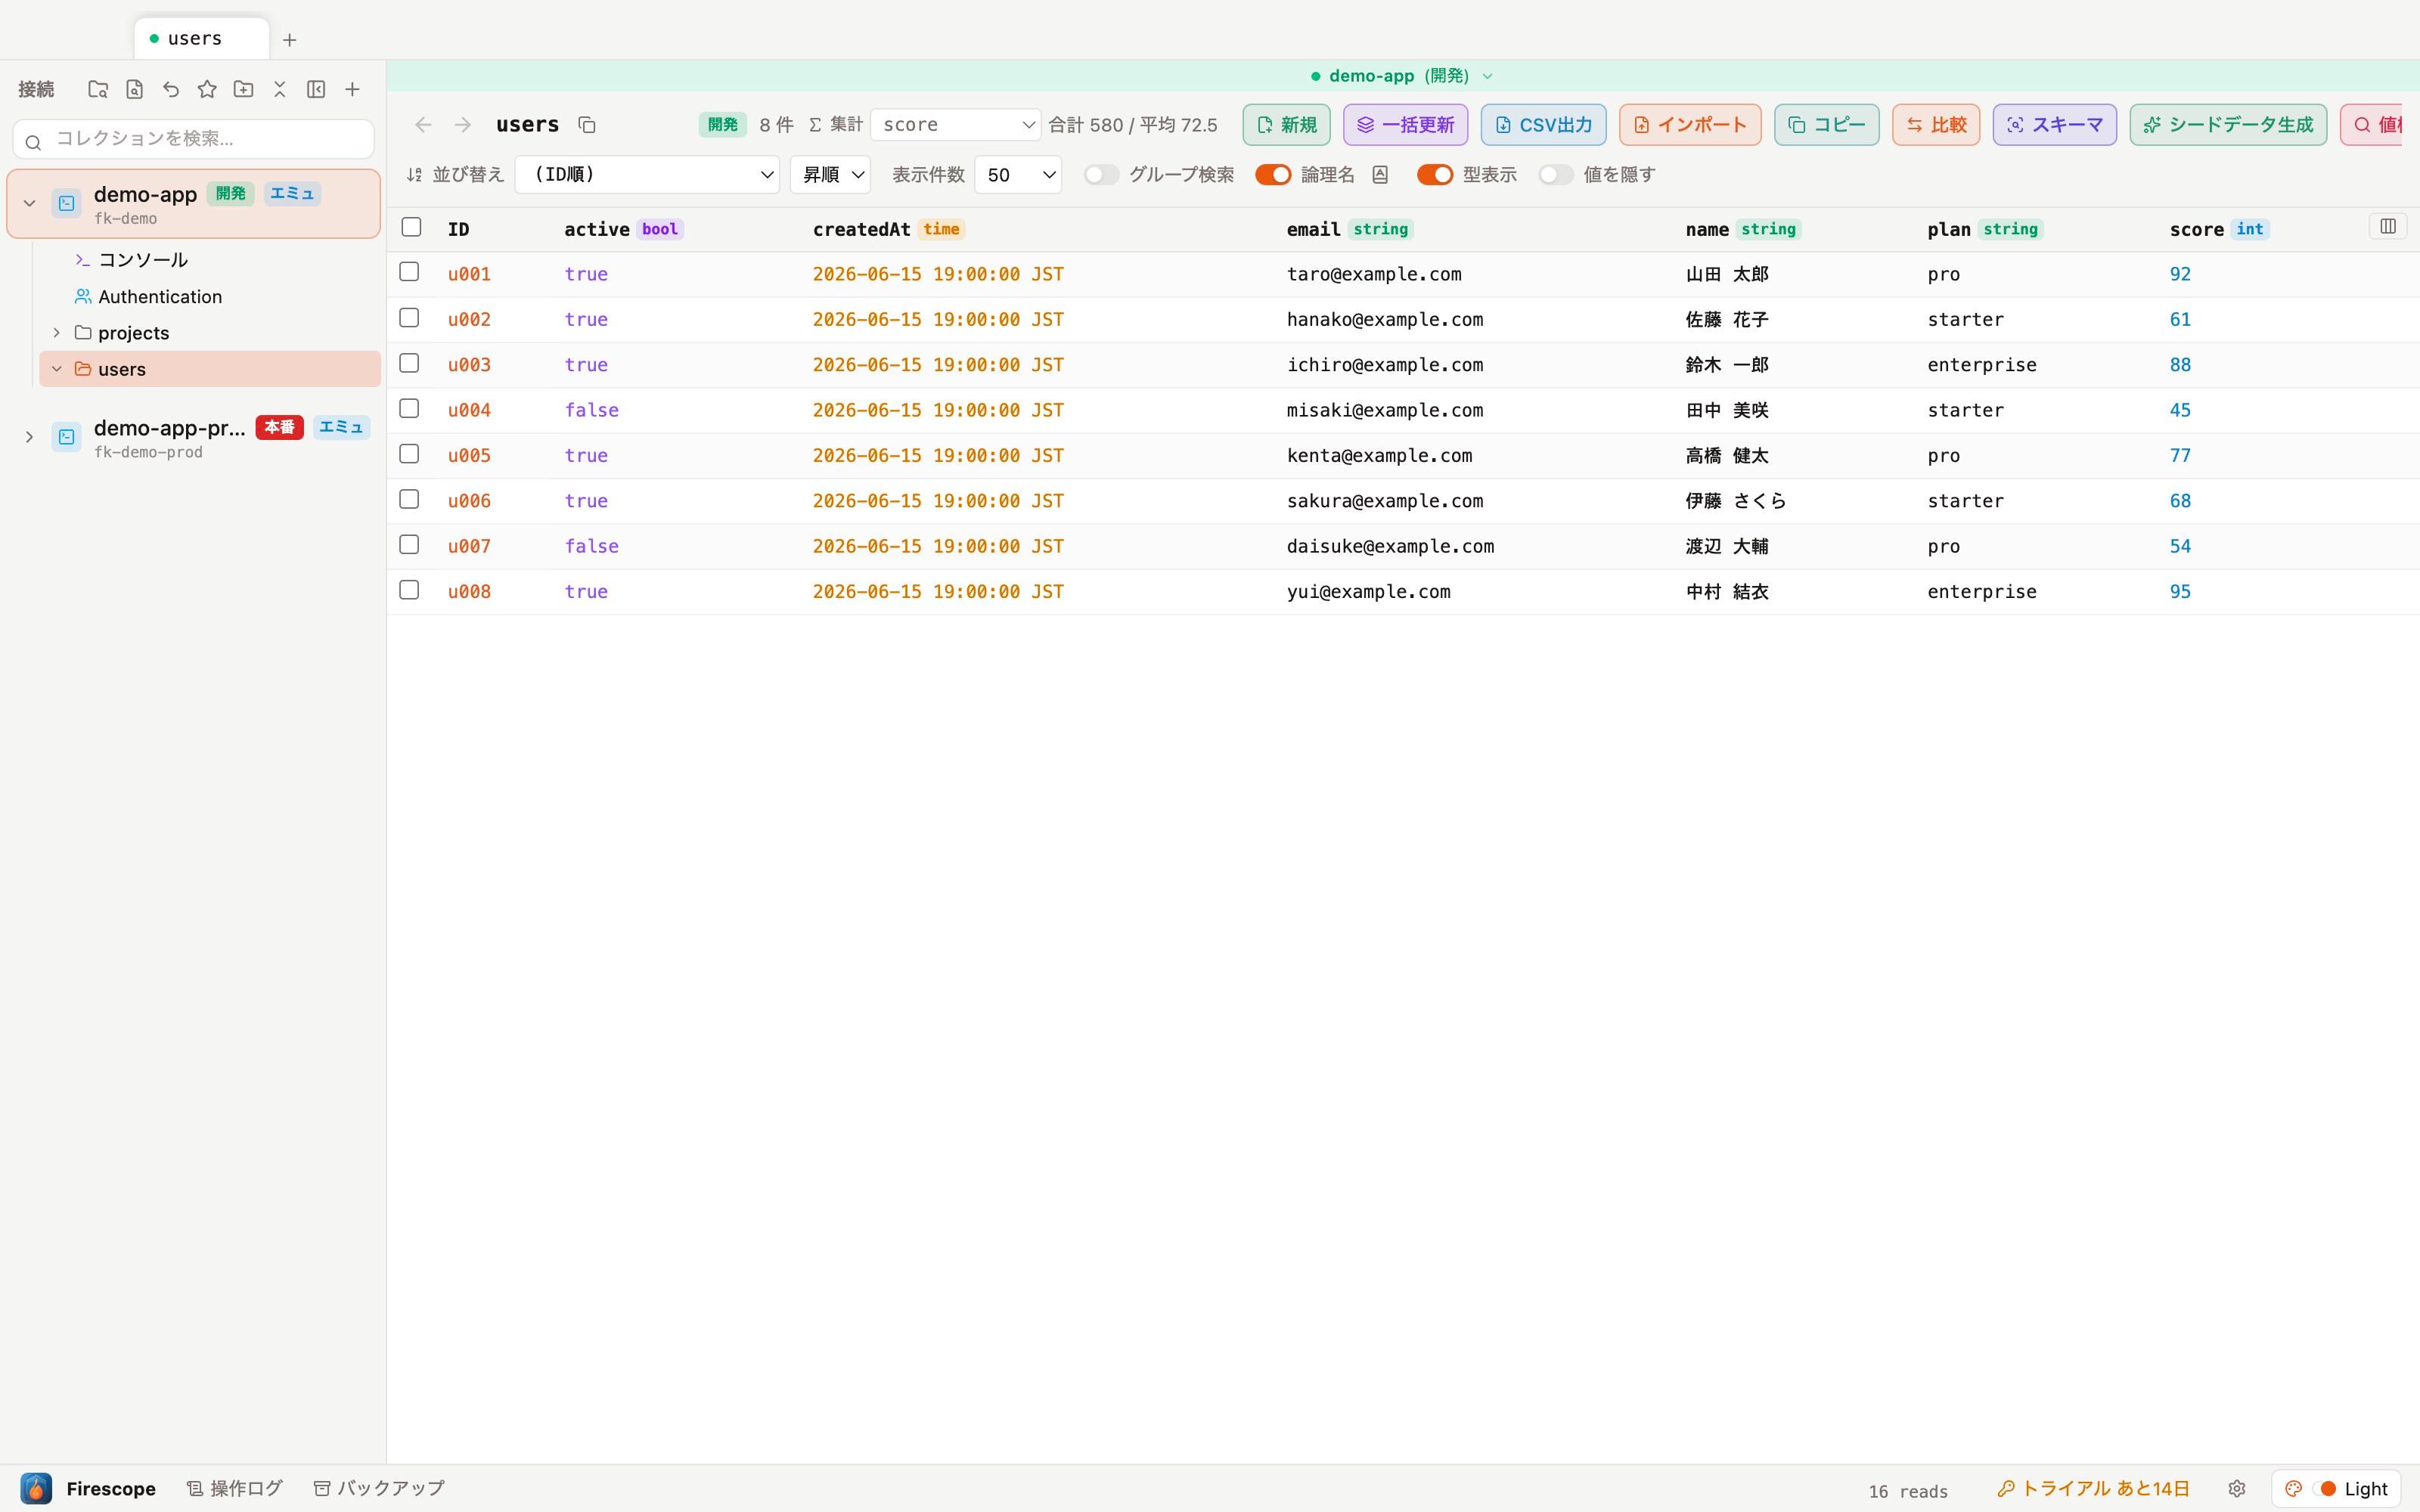
Choose a numeric (int / double) field and the toolbar shows the sum and average after the current filters are applied.
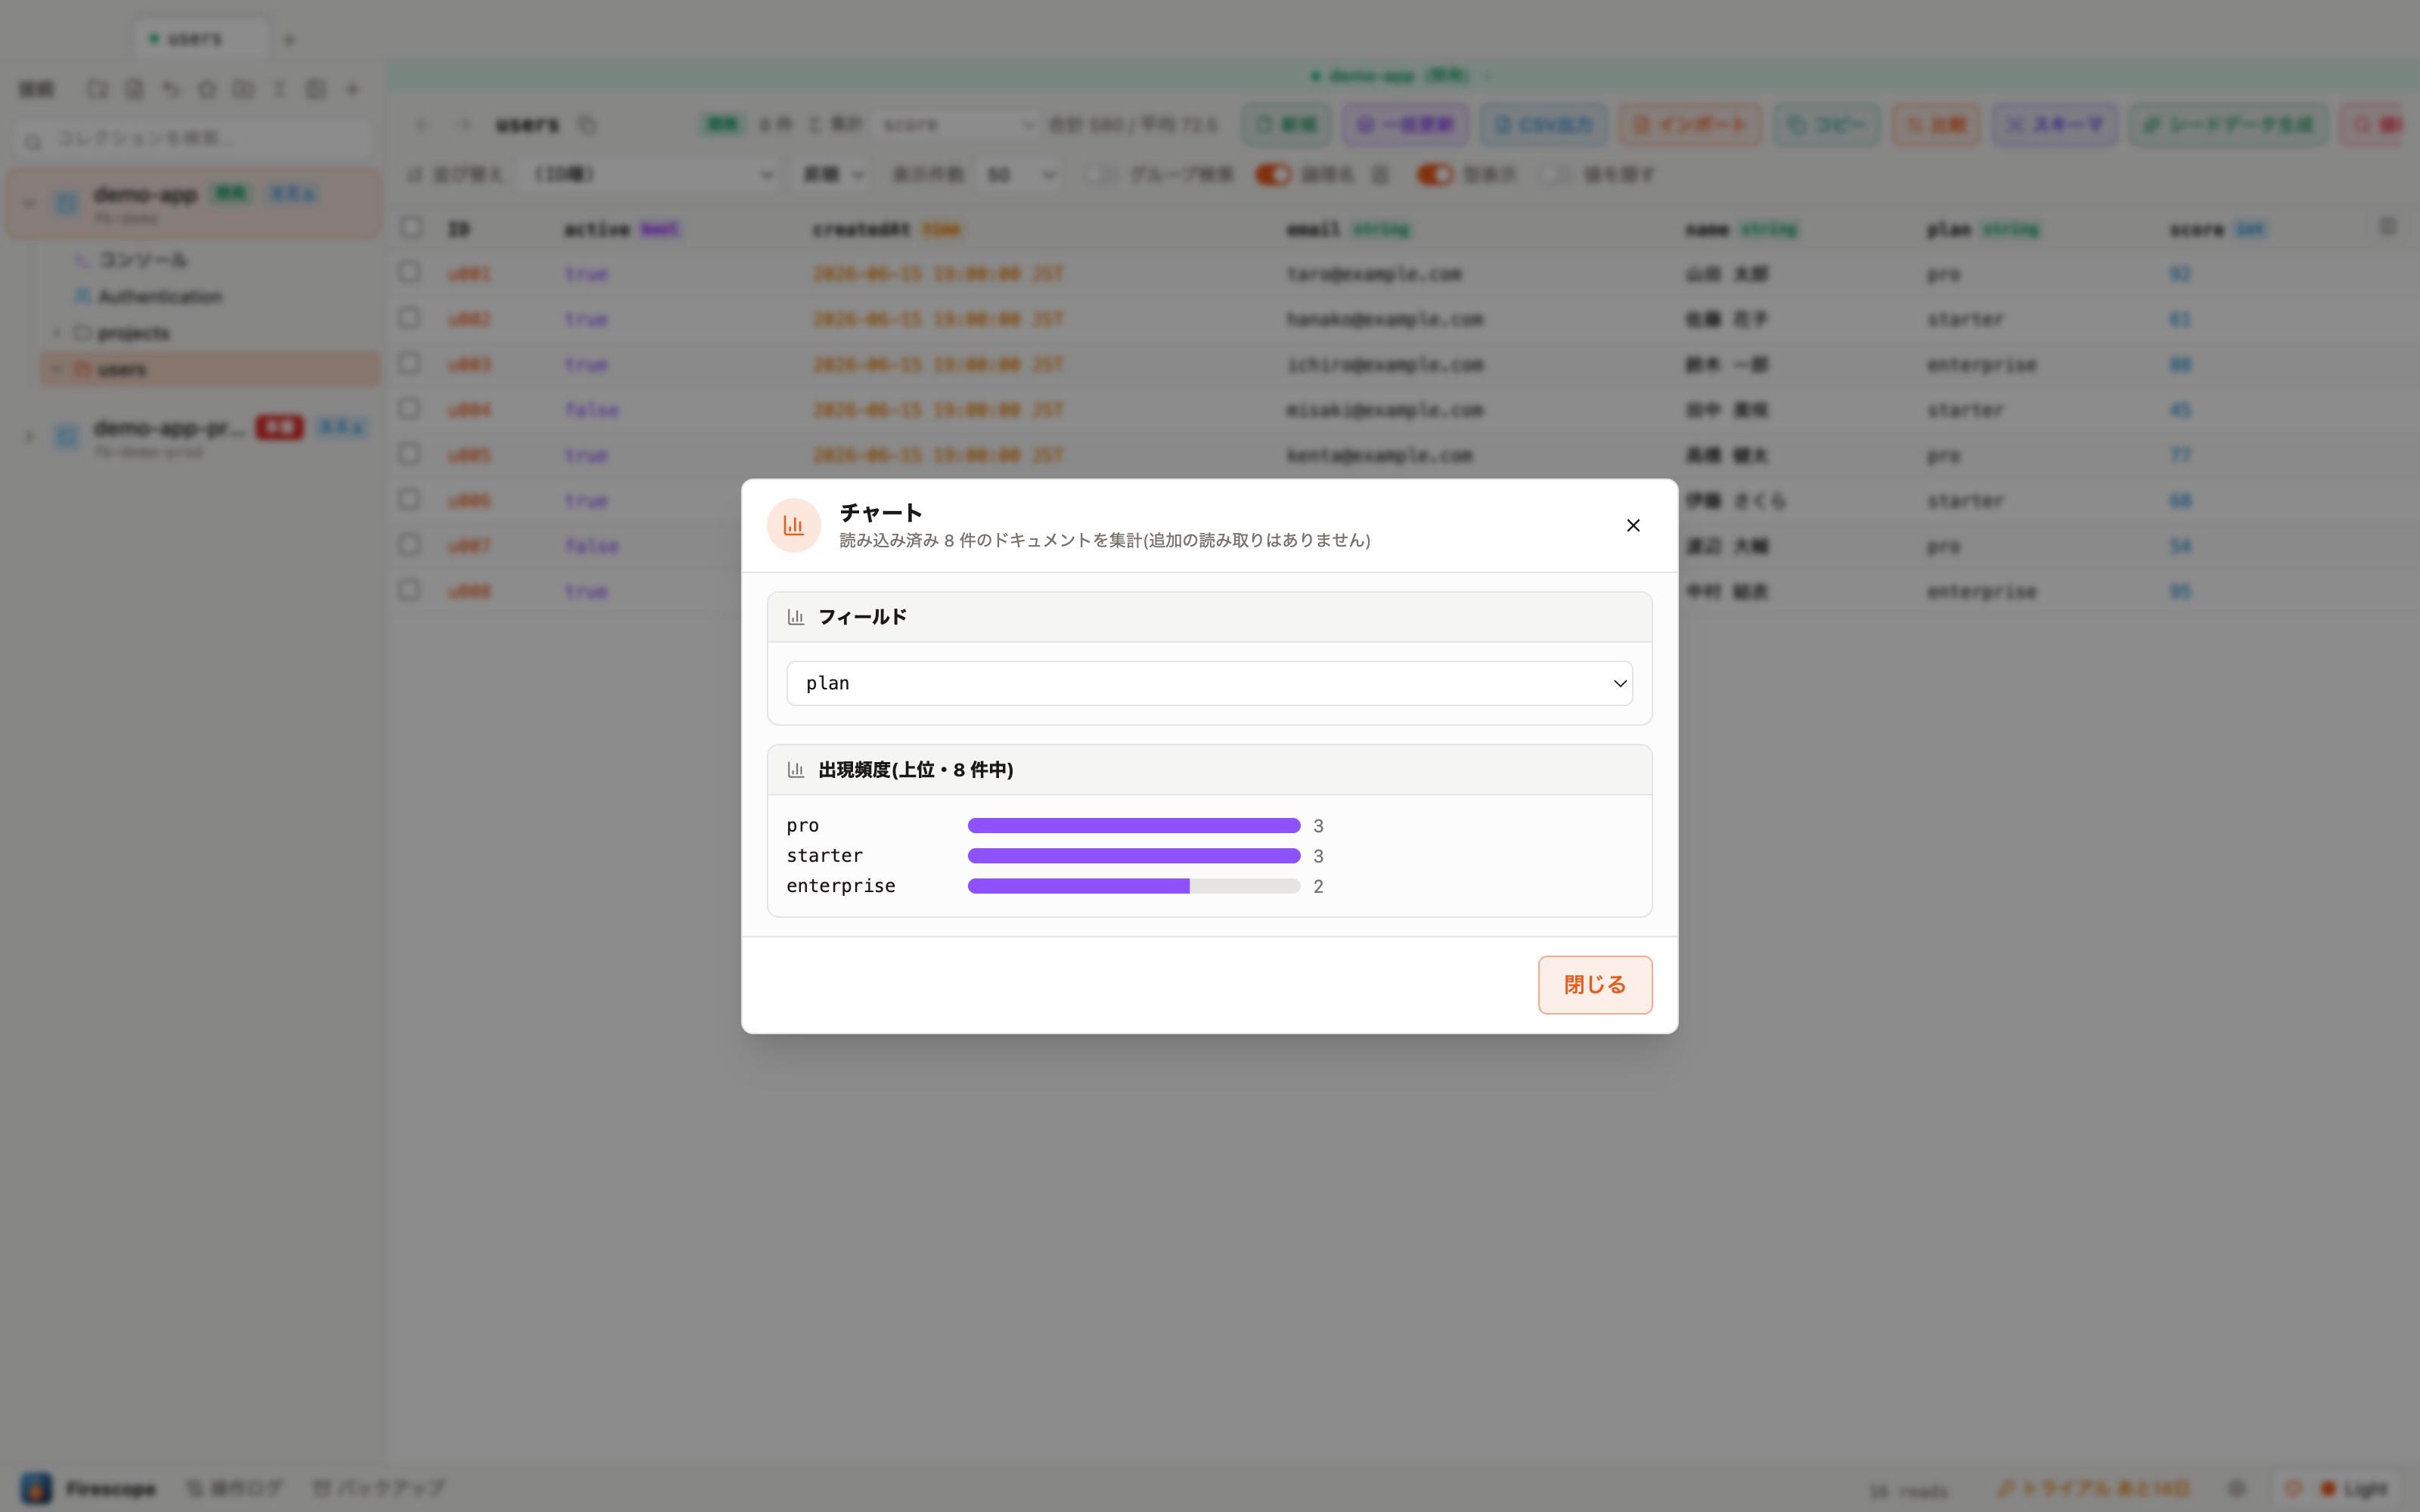
"Chart" instantly draws a histogram for numeric fields and a frequency chart (top 10) for string/enum fields, based on the documents already loaded. No extra reads are performed.
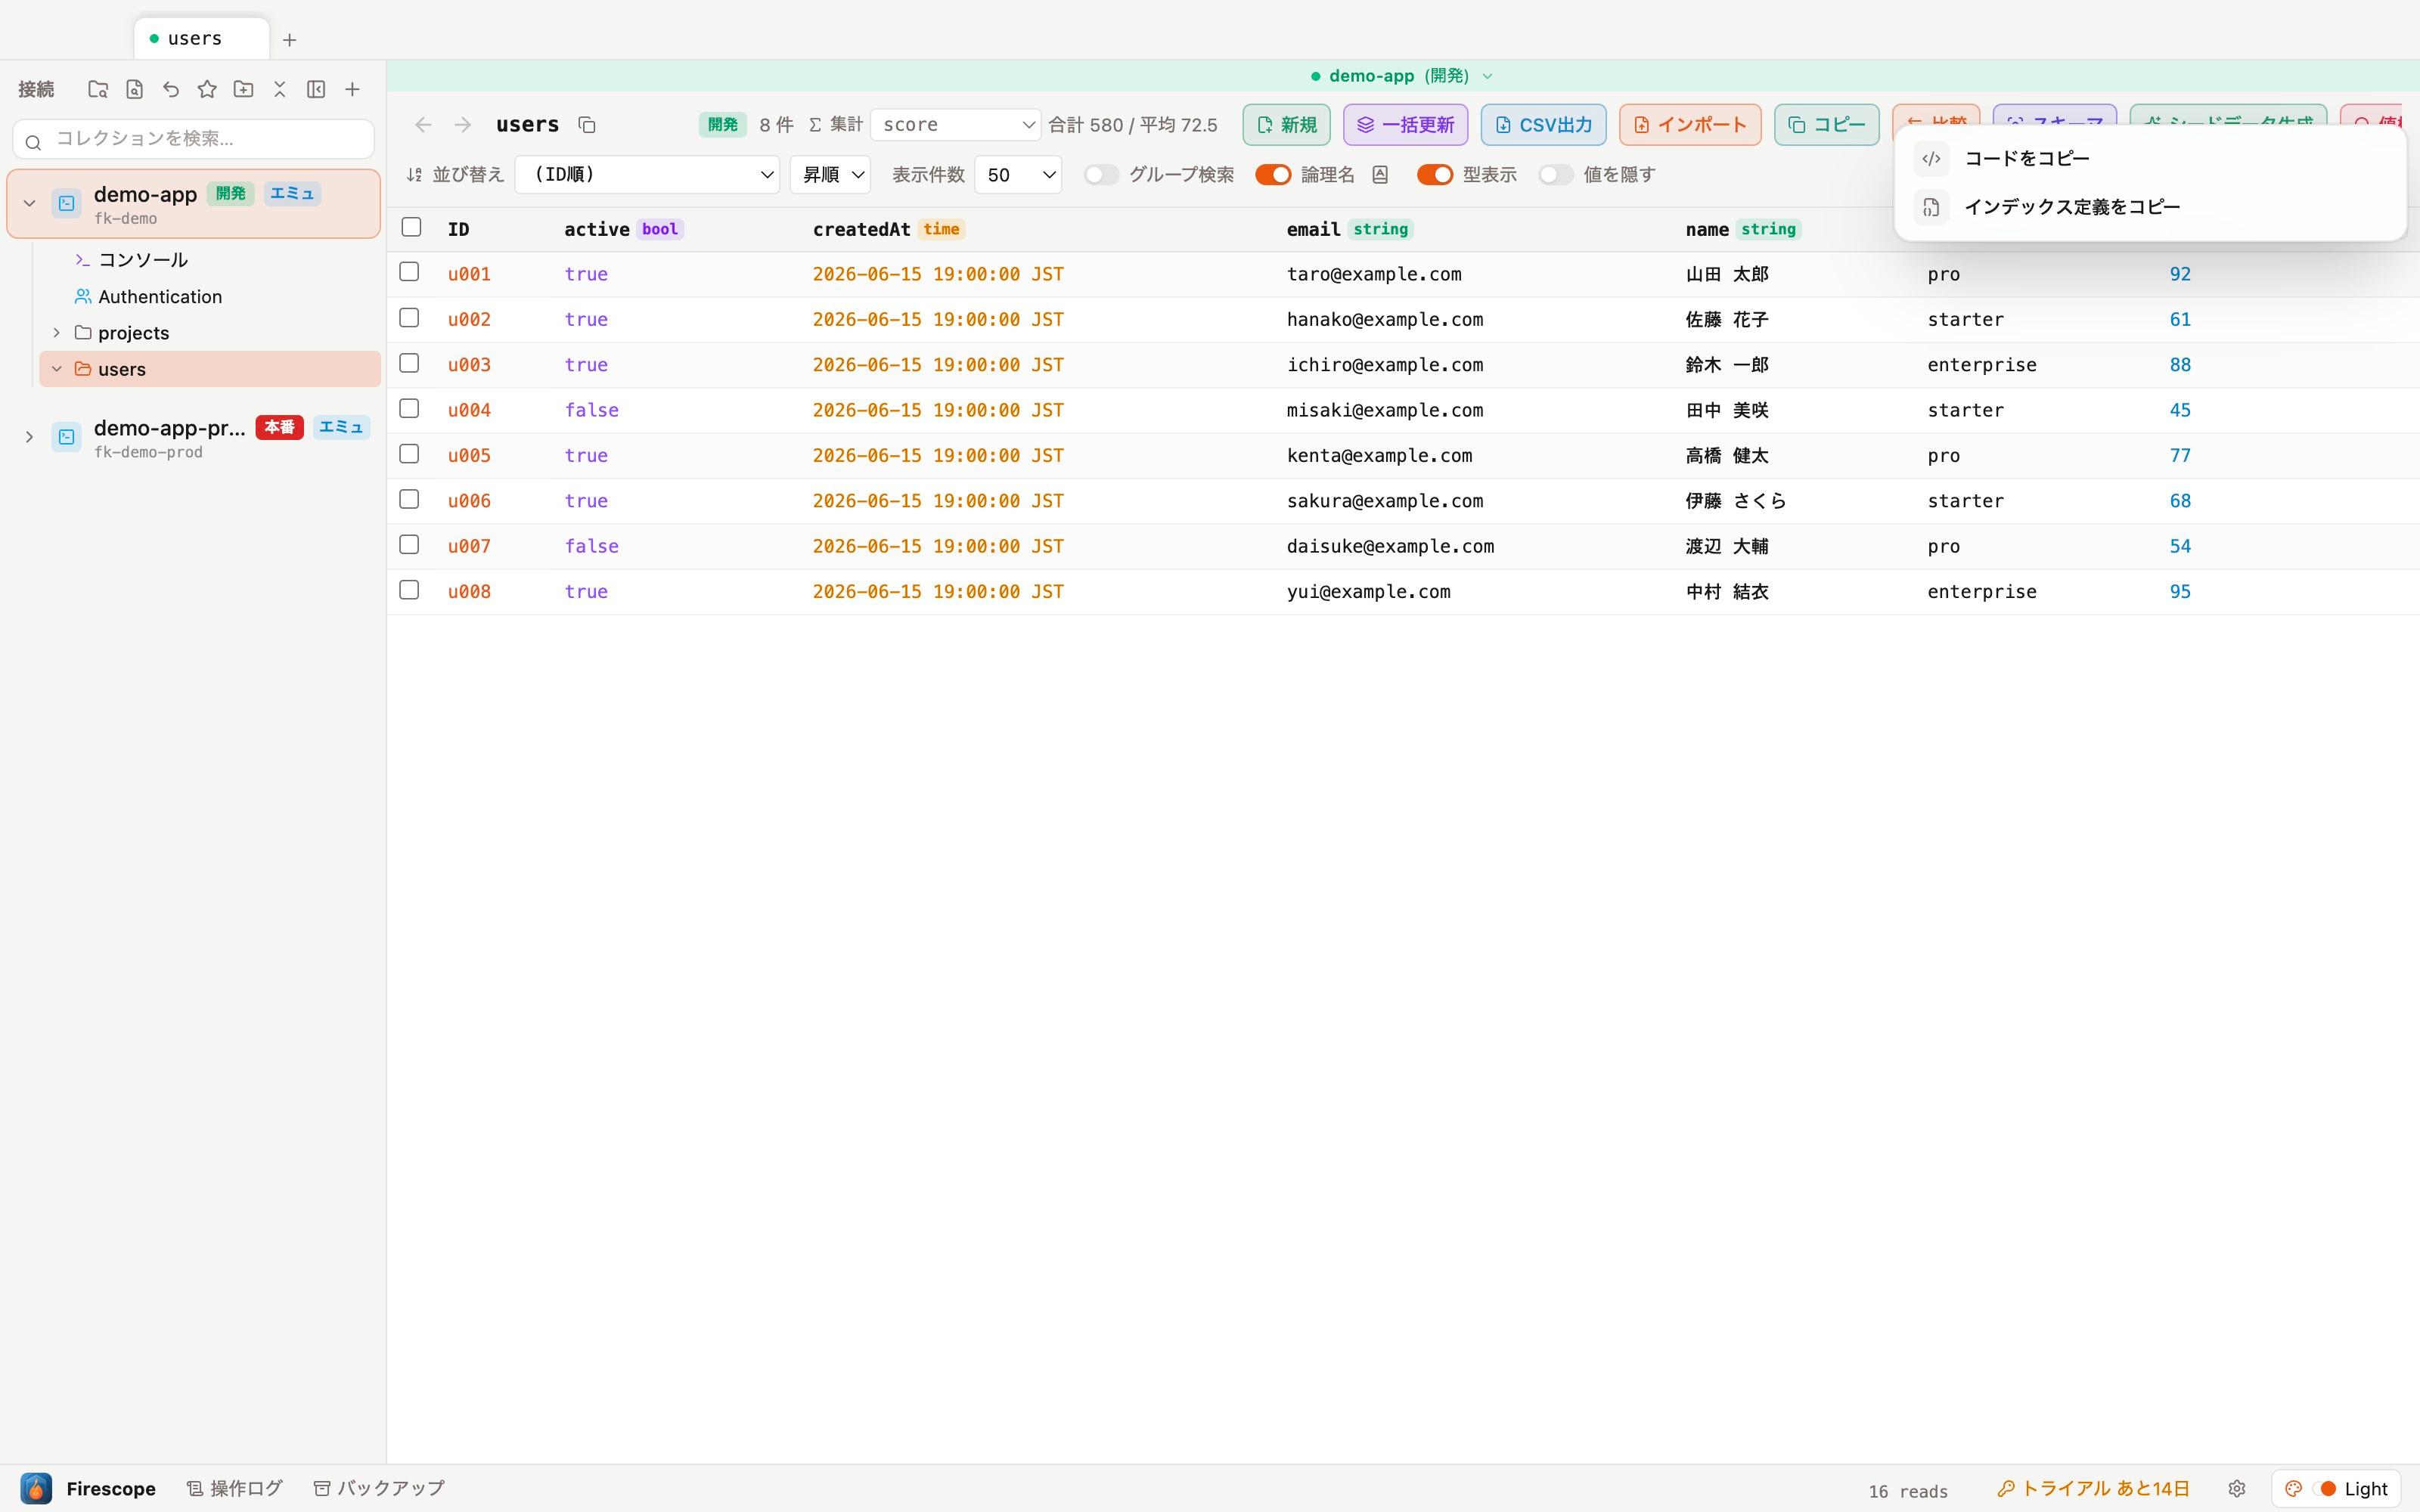
"Generate code" lets you copy the query you built as firebase-admin (Node.js) code, or, for conditions that need a composite index, as a firestore.indexes.json definition.
Logical names (translated field labels)
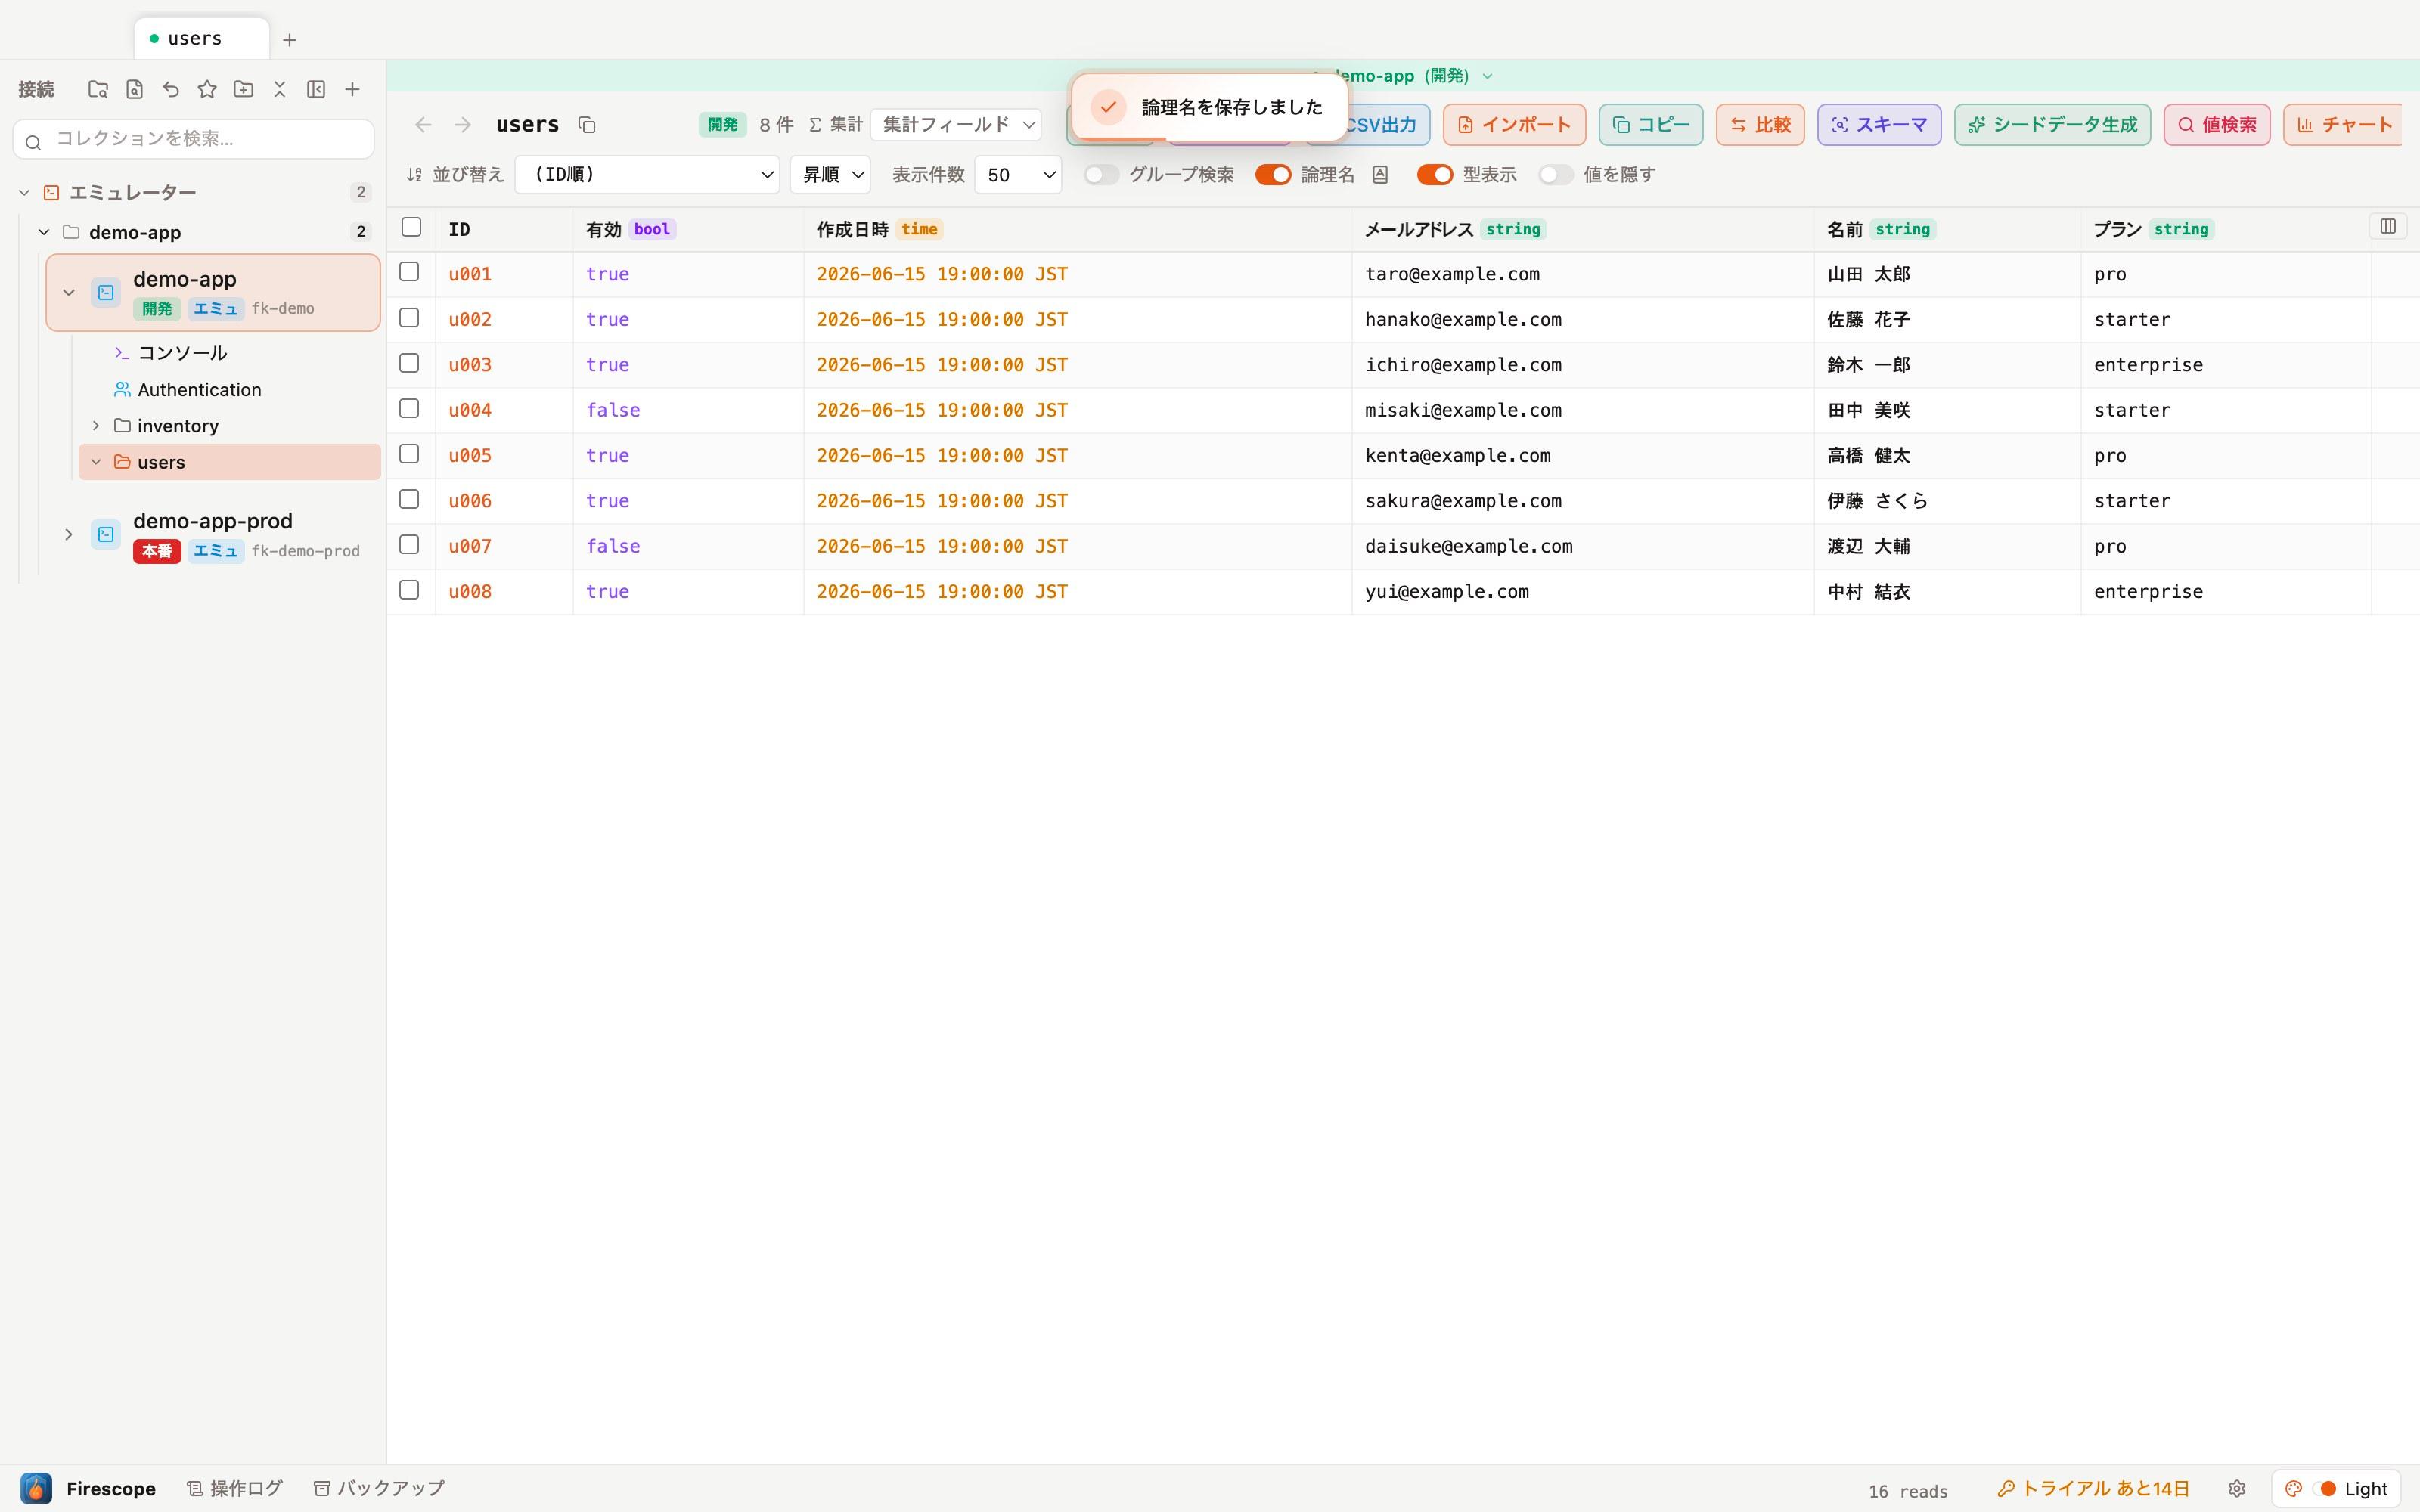
English field names like carryingOutCoffinMasterId can be displayed with logical names in Japanese or any other language. The "Logical names" toggle in the toolbar switches between physical and logical names at any time.
- Edit the dictionary from the 📖 icon in the toolbar. Scope is two-layered: "shared across the whole connection" and "this collection only (override)".
- "Auto-translate" fills in blanks in bulk using a built-in dictionary plus a free translation API.
- "Open Google Translate" opens a translation page with the field names already anglicized — copy the translated text back into the app to apply it all at once.
- Right-click a column header → "Set logical name…" to edit just that column right away.
- The type badge in the header (string / int, etc.) can be shown or hidden with the "Show types" toggle.
Tabs and groups
Right-click a collection → "Open in new tab" to add tabs like a browser. Tabs can be organized into groups, just like in Chrome.
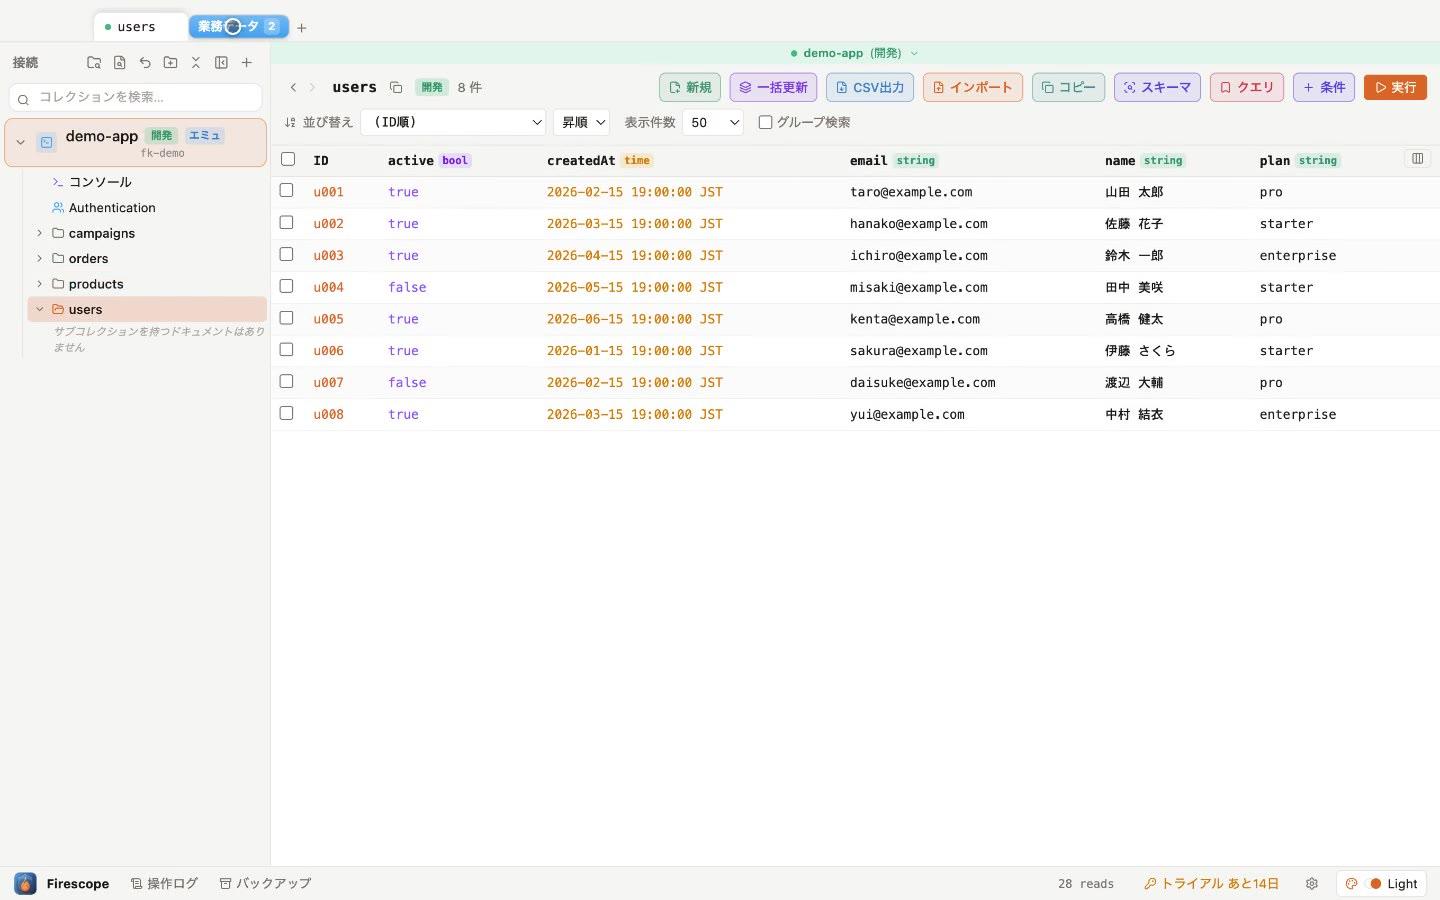
- Right-click a tab → "Add to new group" to create a group. You can give it a name and color.
- Click a group chip to collapse or expand it.
- Double-click a tab to change its name and background color.
- Drag and drop to reorder tabs and move them in and out of groups.
- Tab state is restored after a restart (this can be turned off in settings).
Split view
Right-click a collection → "Split view to the right" to place two collections side by side. Handy for cross-checking master data against transactions.
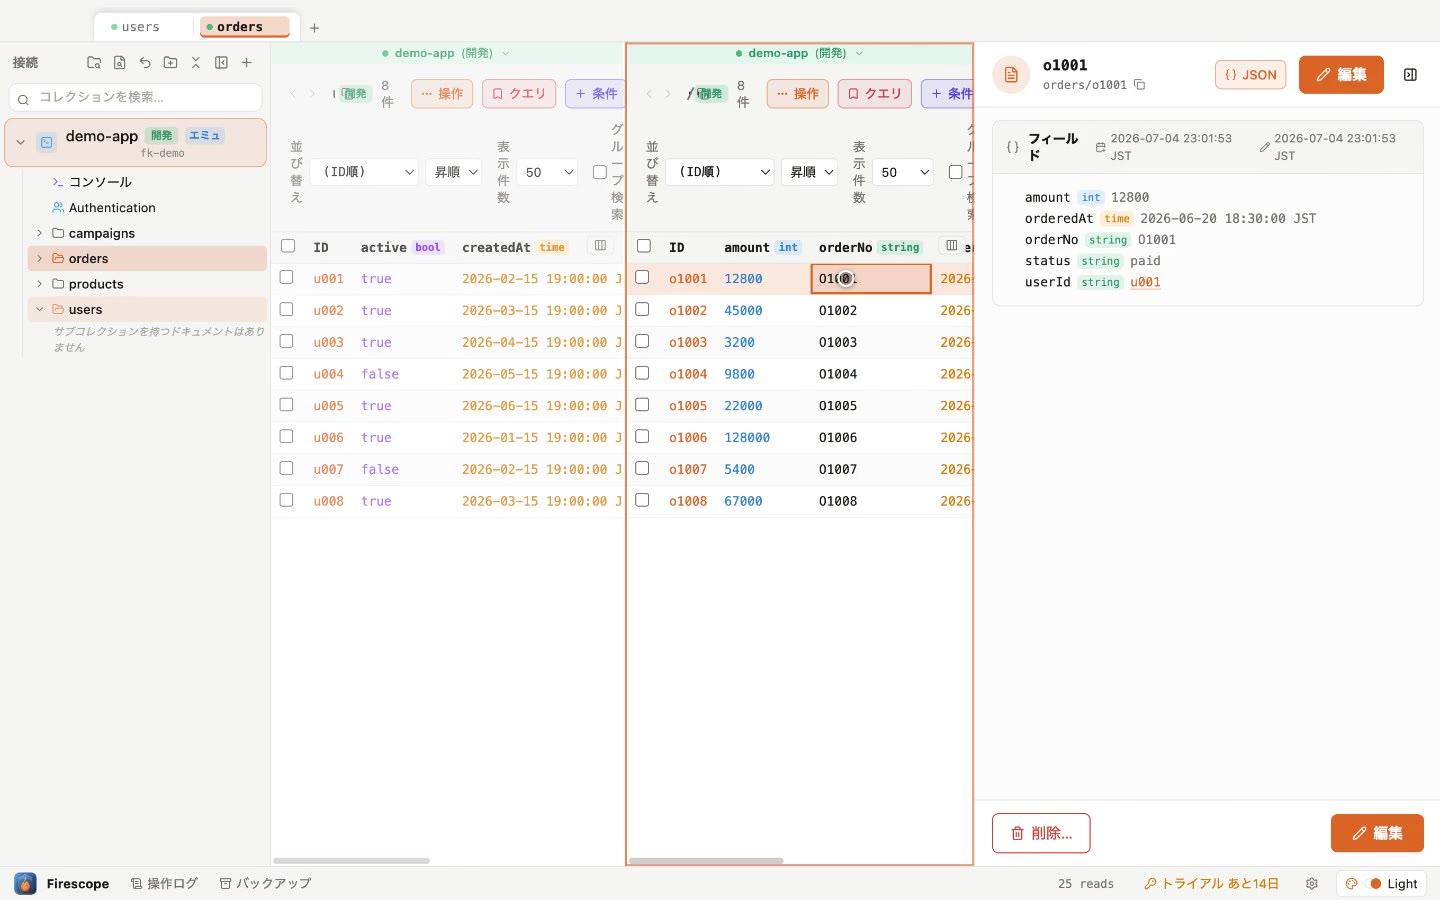
- You can also split by dragging a collection from the sidebar to the left or right edge of the screen.
- Drag a pane's chip to swap the left and right panes or pull it out into a new tab.
- Split state is preserved per tab.
Real-time watch
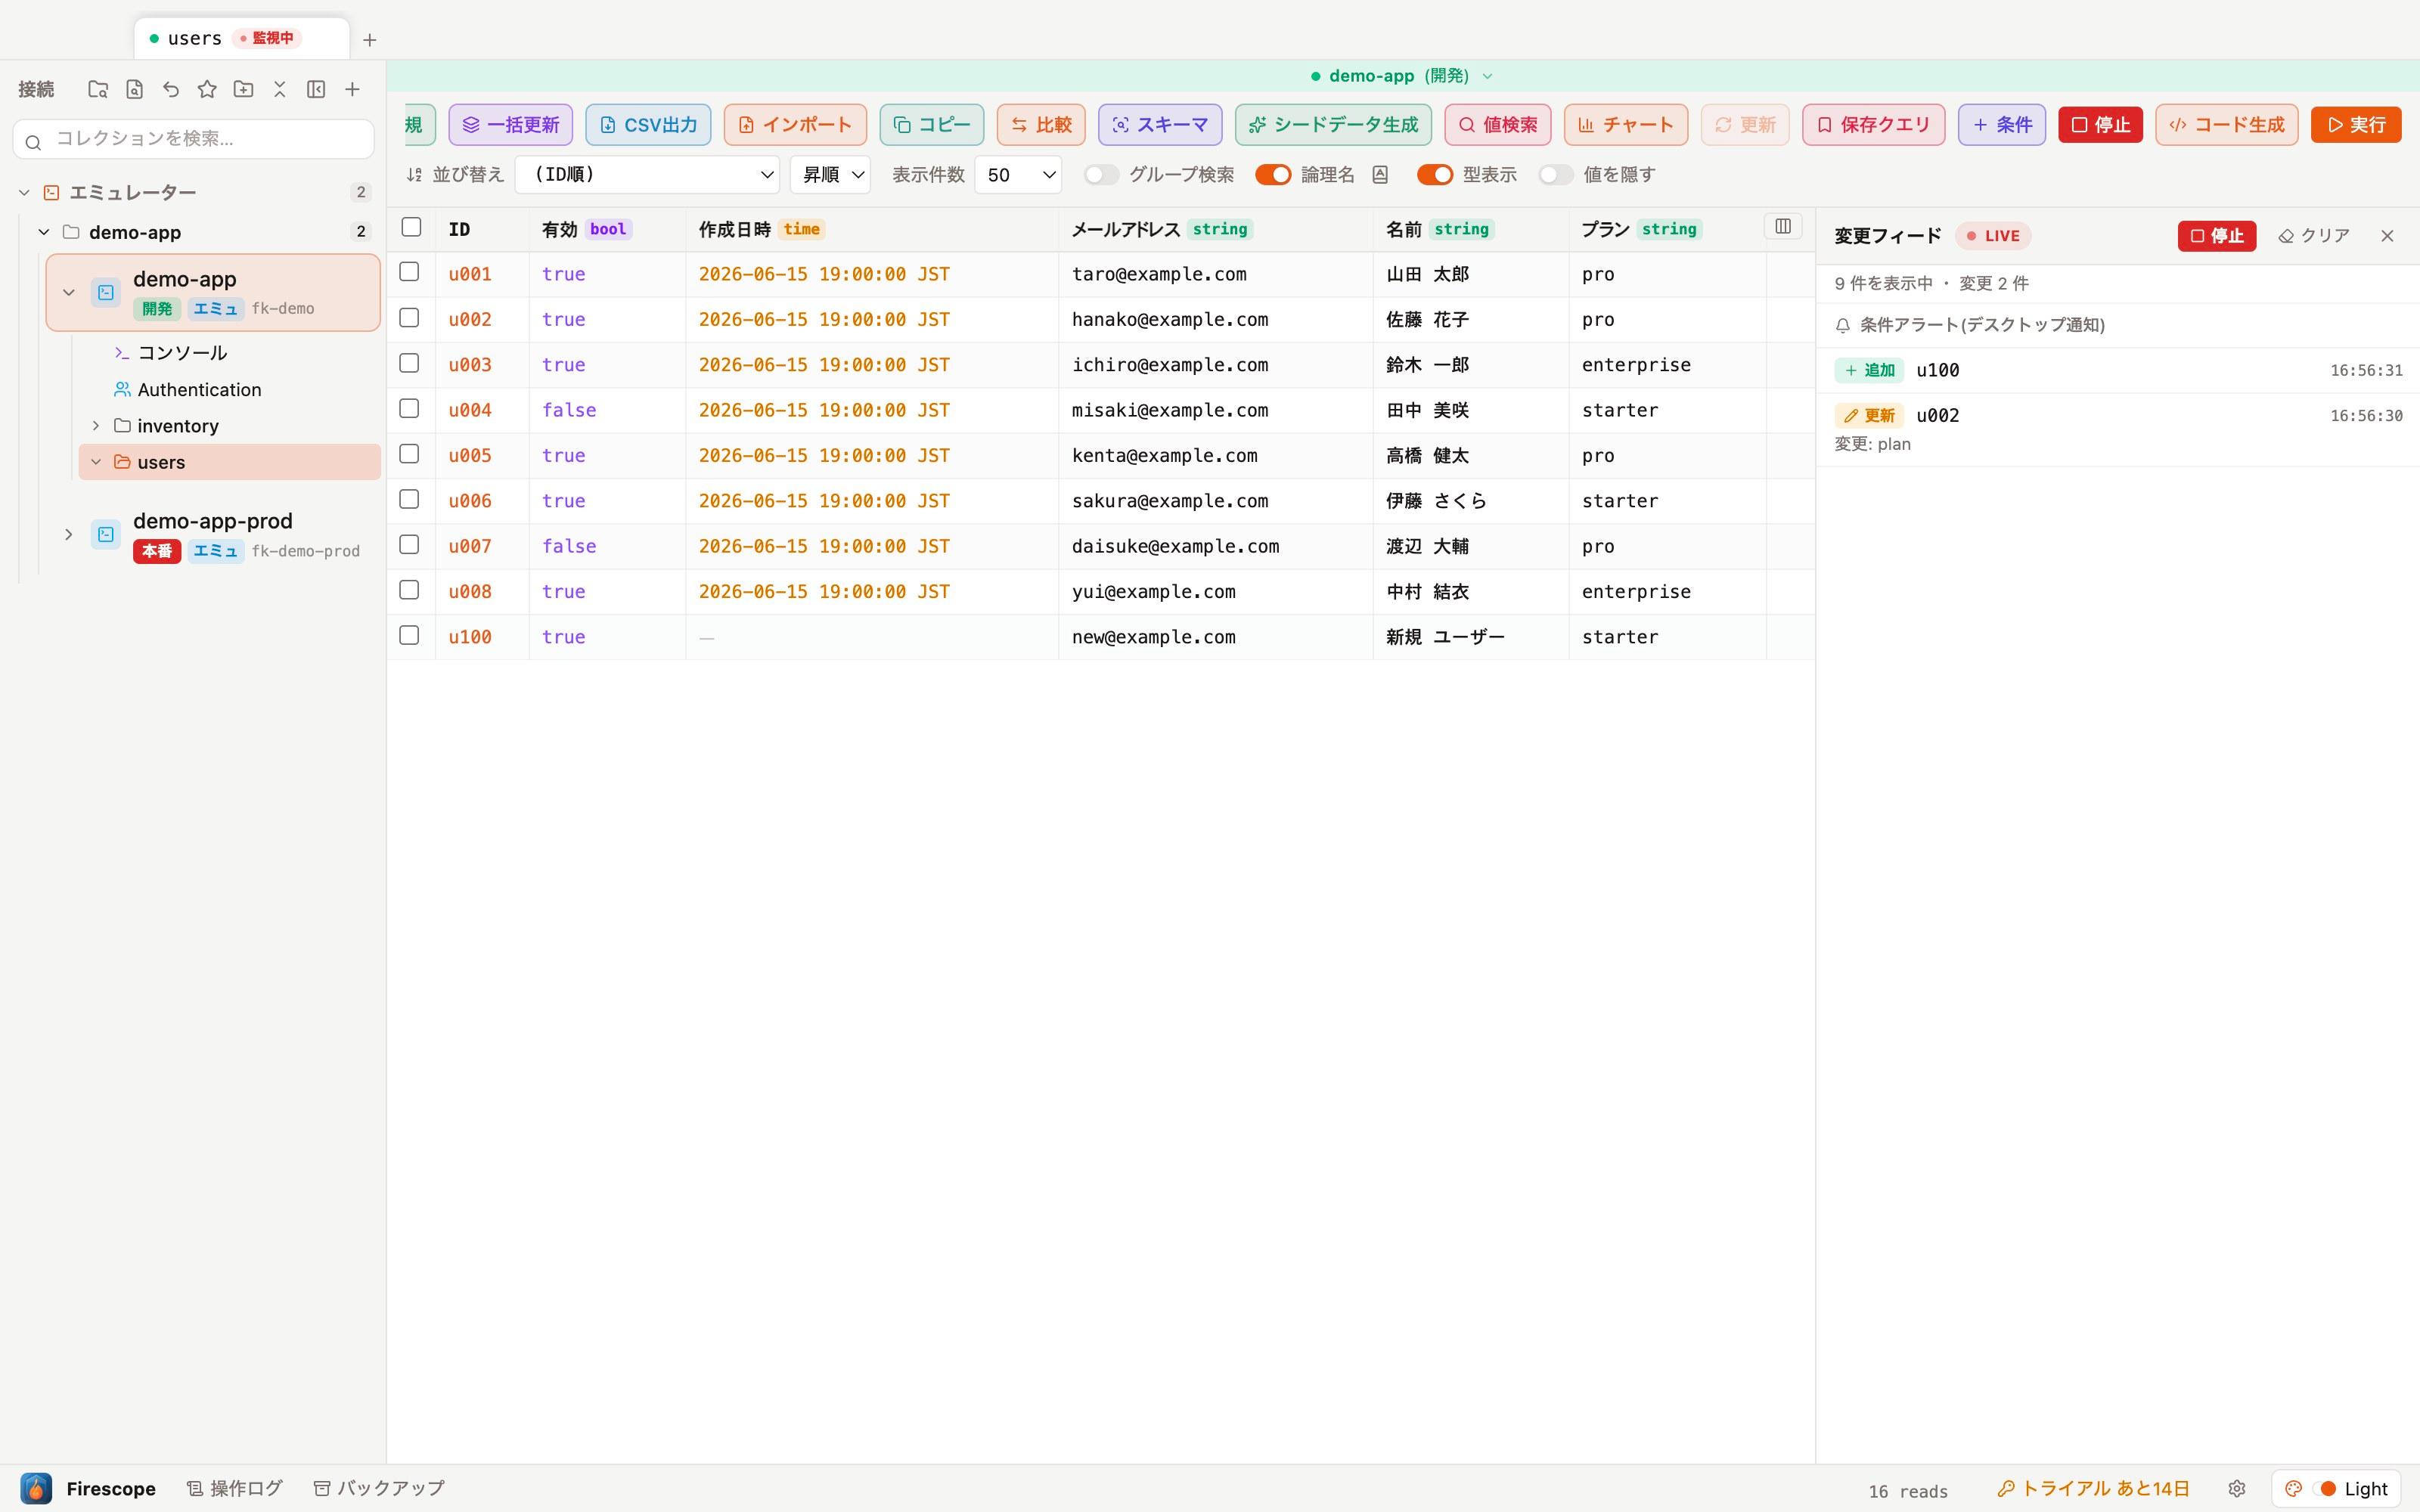
Click "Watch" in the toolbar and changes to the currently displayed collection are reflected live in the grid. Writes from another app or server flow in without any reload.
- Before starting, a dialog lets you narrow things down by condition (field/value), sort order, and count.
- The change feed on the right lists "added / updated / deleted" events in chronological order, along with which fields changed.
- Watching is read-only. Any writes you make while watching still go through the normal safety pipeline.
- Up to 5 watches can run at the same time.
- Watches stop automatically after a set time (configurable in settings), to prevent excessive read usage.
Editing data
Double-click a cell to edit it in place. Press Enter to confirm or Esc to cancel. Types such as int and timestamp are preserved when written.
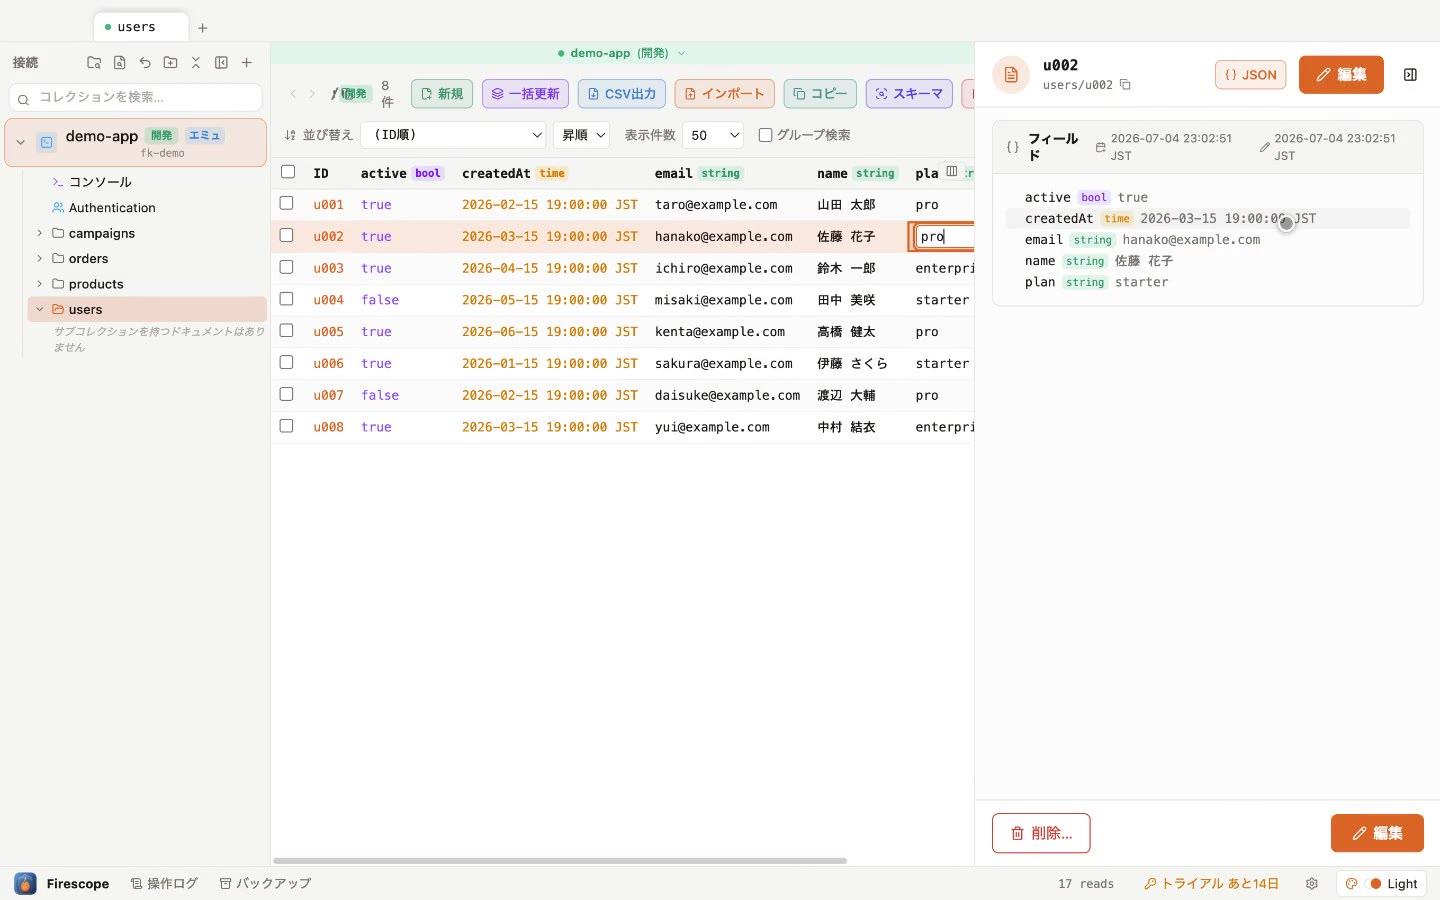
Every write goes through the safety pipeline:
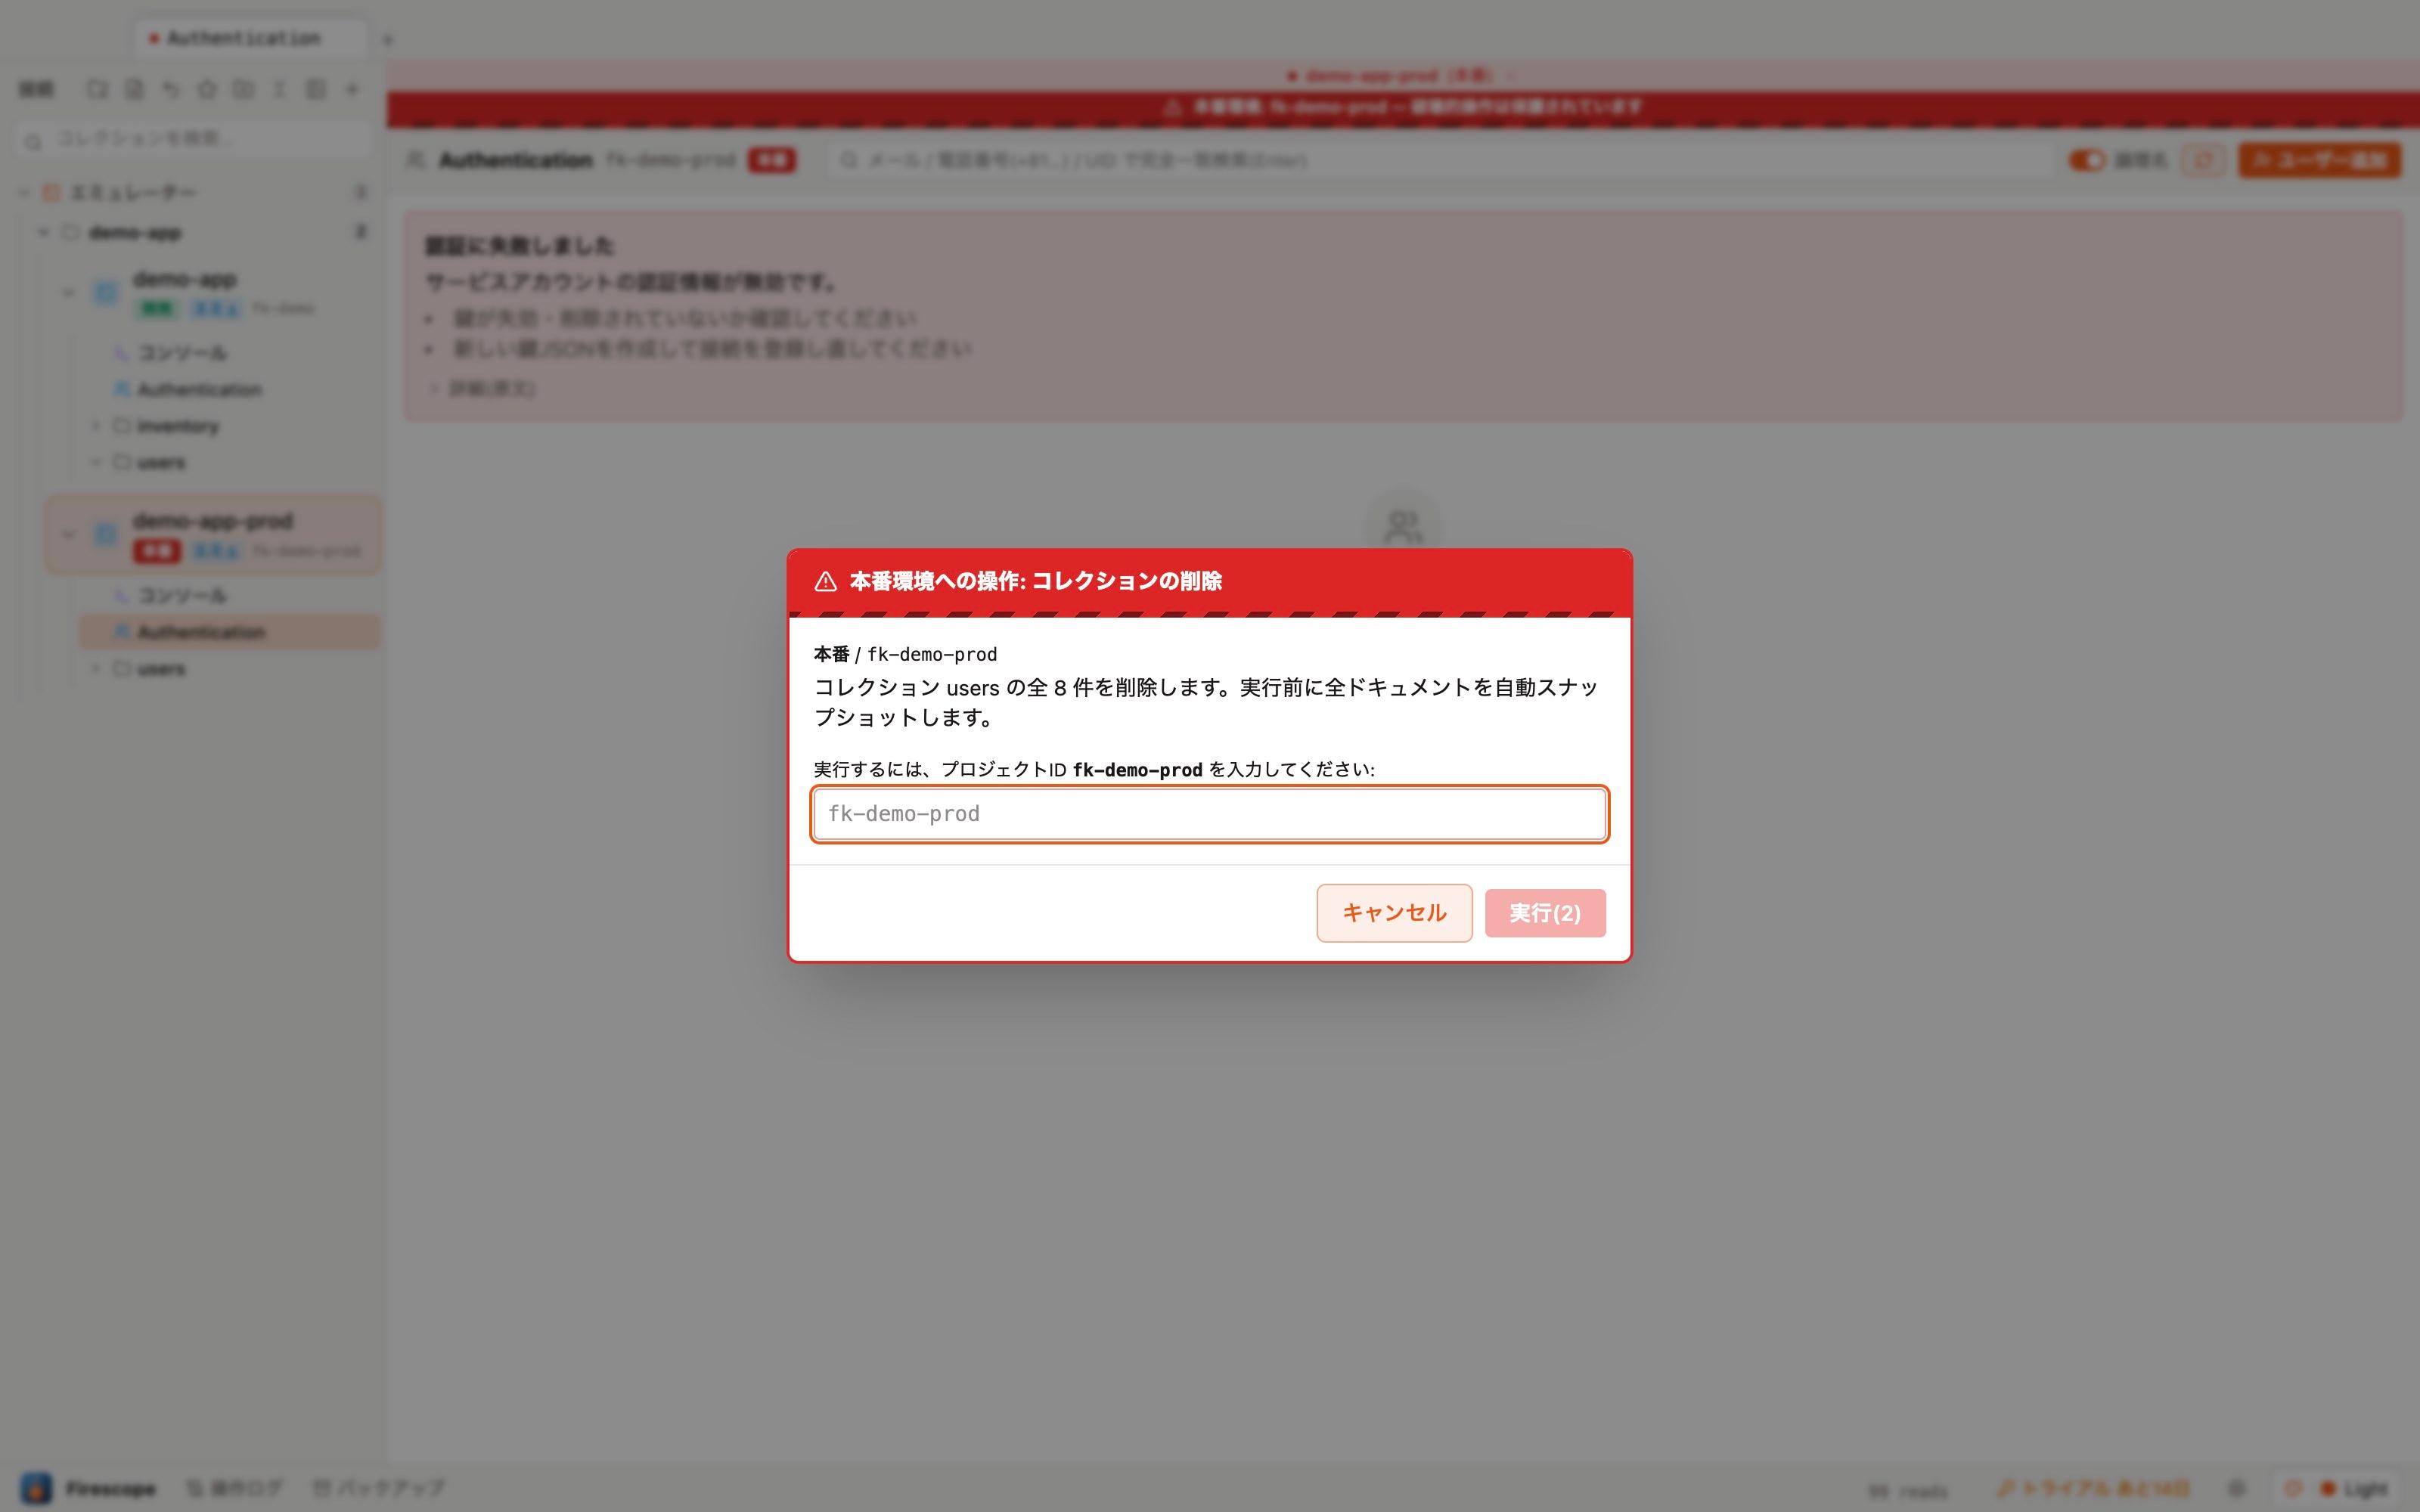
- Confirmation — a dialog appears whose strength depends on the environment label and the operation's risk level. Destructive operations in production require typing the project ID.
- Automatic backup — affected documents are snapshotted before execution.
- Execution — the write is performed.
- Operation log — recorded regardless of success or failure (check it from "Operation log" in the bottom bar).
Backup and restore
Snapshots taken just before a destructive operation accumulate under "Backups" in the bottom bar. Selecting one opens a restore preview where you can check the diff (recreate / overwrite / unchanged) before restoring.
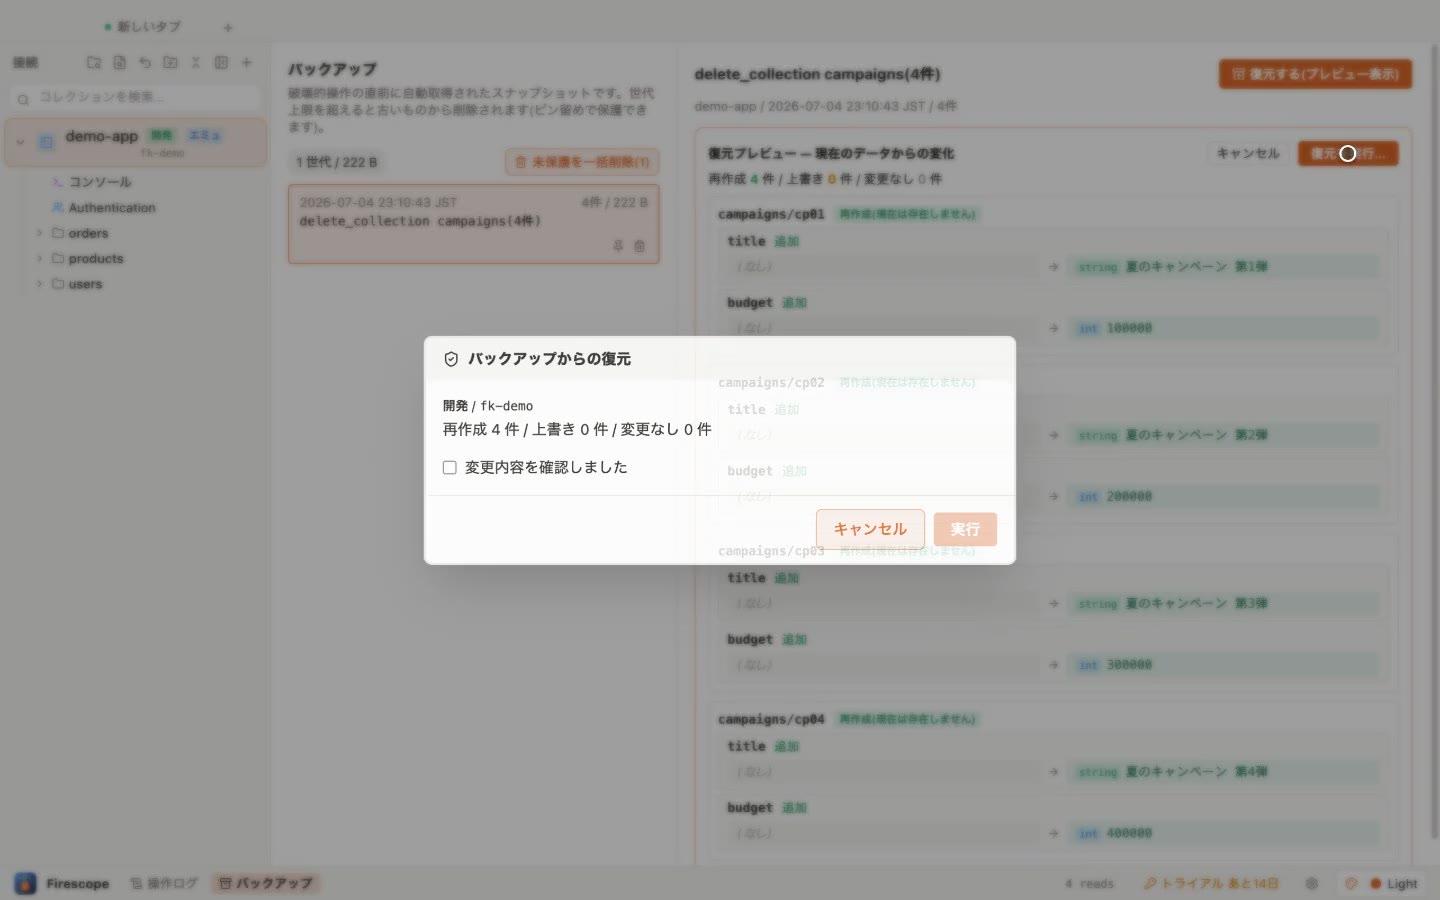
- Press ⌘Z (or the ↩︎ icon in the sidebar) to instantly restore the most recent write.
- Snapshots beyond the generation limit are removed oldest-first. Pin 📌 any you want to keep.
Console
The "Console" in the sidebar lets you write queries in firebase-admin-style JavaScript. Press ⌘Enter to run it, and the result is shown in a type-annotated table.
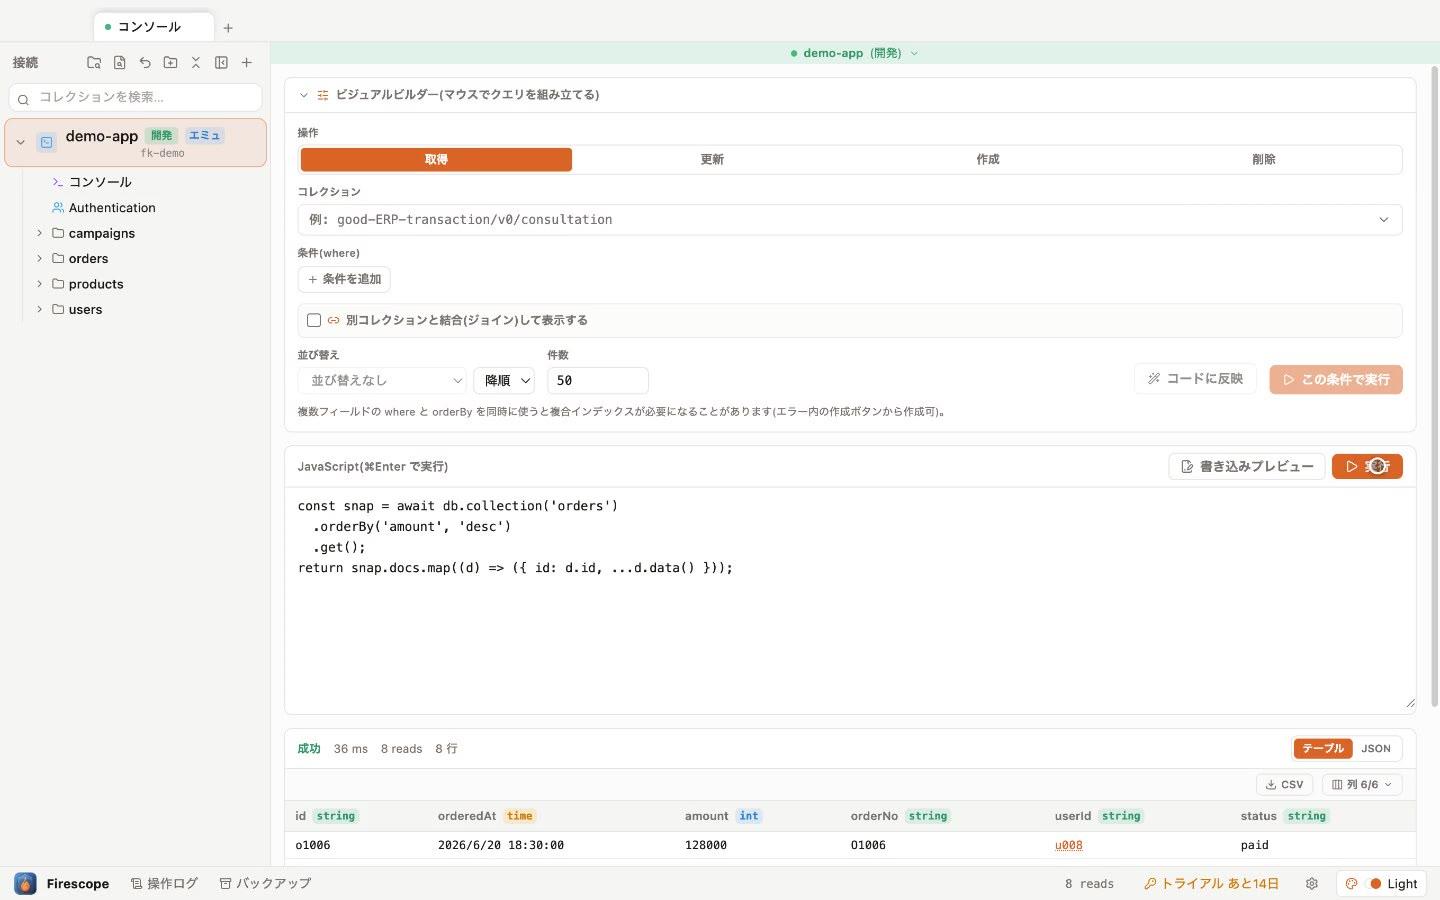
const snap = await db.collection('orders')
  .where('status', '==', 'paid')
  .orderBy('amount', 'desc')
  .limit(20)
  .get();
return snap.docs.map((d) => ({ id: d.id, ...d.data() }));- For mouse-driven workflows there's also a visual builder (get / update / create / delete). Any conditions you build can be converted to JS with "Reflect in code".
- Code that includes writes runs as dry run → write preview → apply, so data never changes unexpectedly.
- Join views are also supported.
CSV import/export
Export
Click "Export CSV" in the collection toolbar to save the current query result (with filters and sorting applied) as CSV. Headers include type annotations, so re-importing later preserves types correctly.
Import
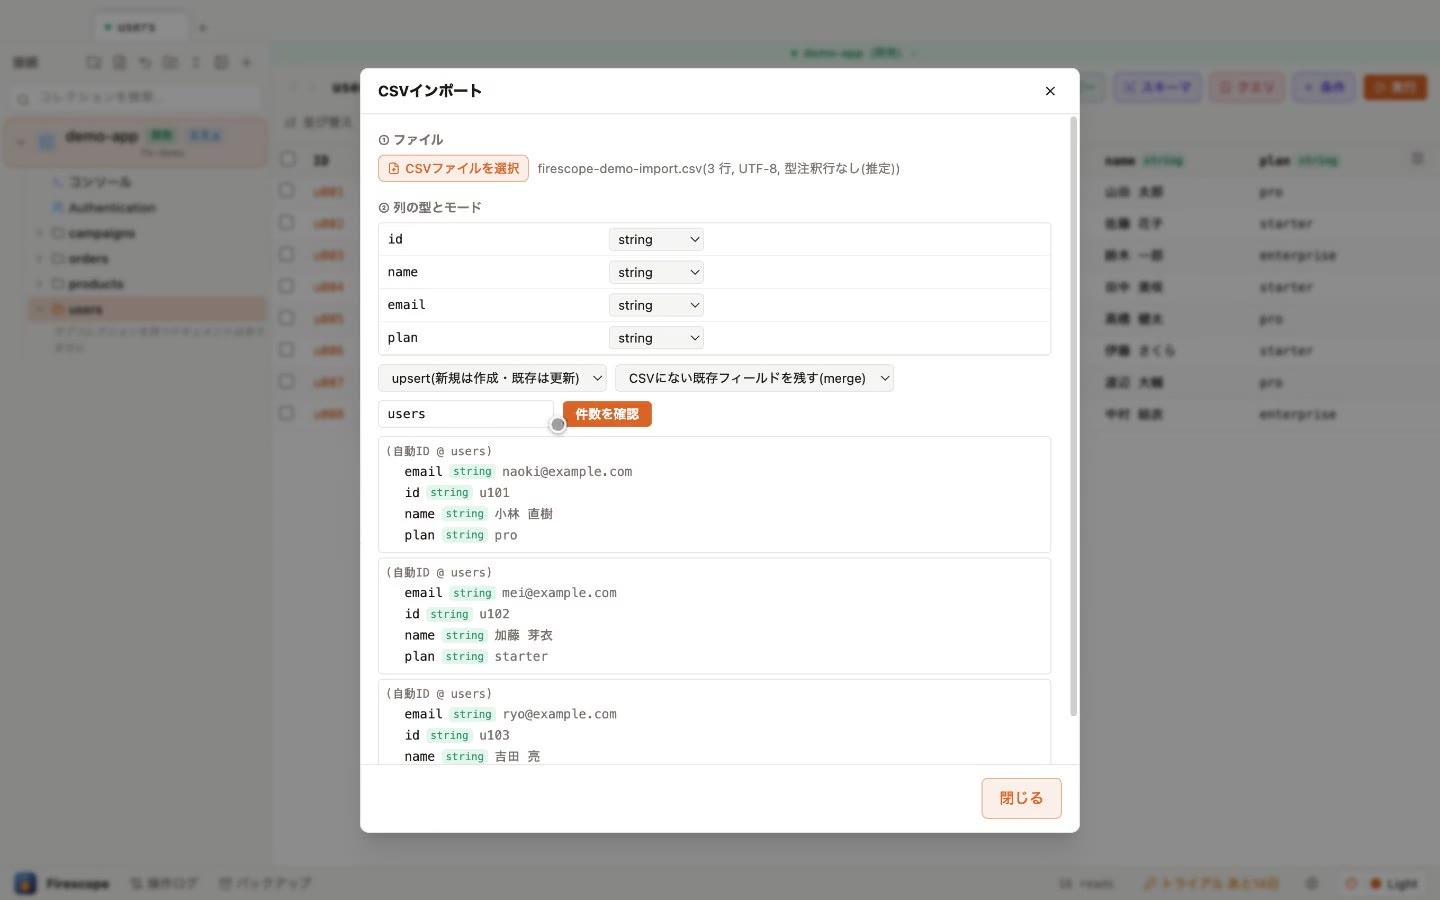
- Click "Import" in the toolbar and select a CSV file (Shift_JIS is auto-detected).
- Review each column's type and the mode (upsert / new only / update only).
- Click "Check counts" to preview how many rows will be new vs. overwritten.
- Click "Run import" → confirm in the dialog to import. Overwritten rows are automatically backed up before the import runs.
Schema check (detecting schema drift)
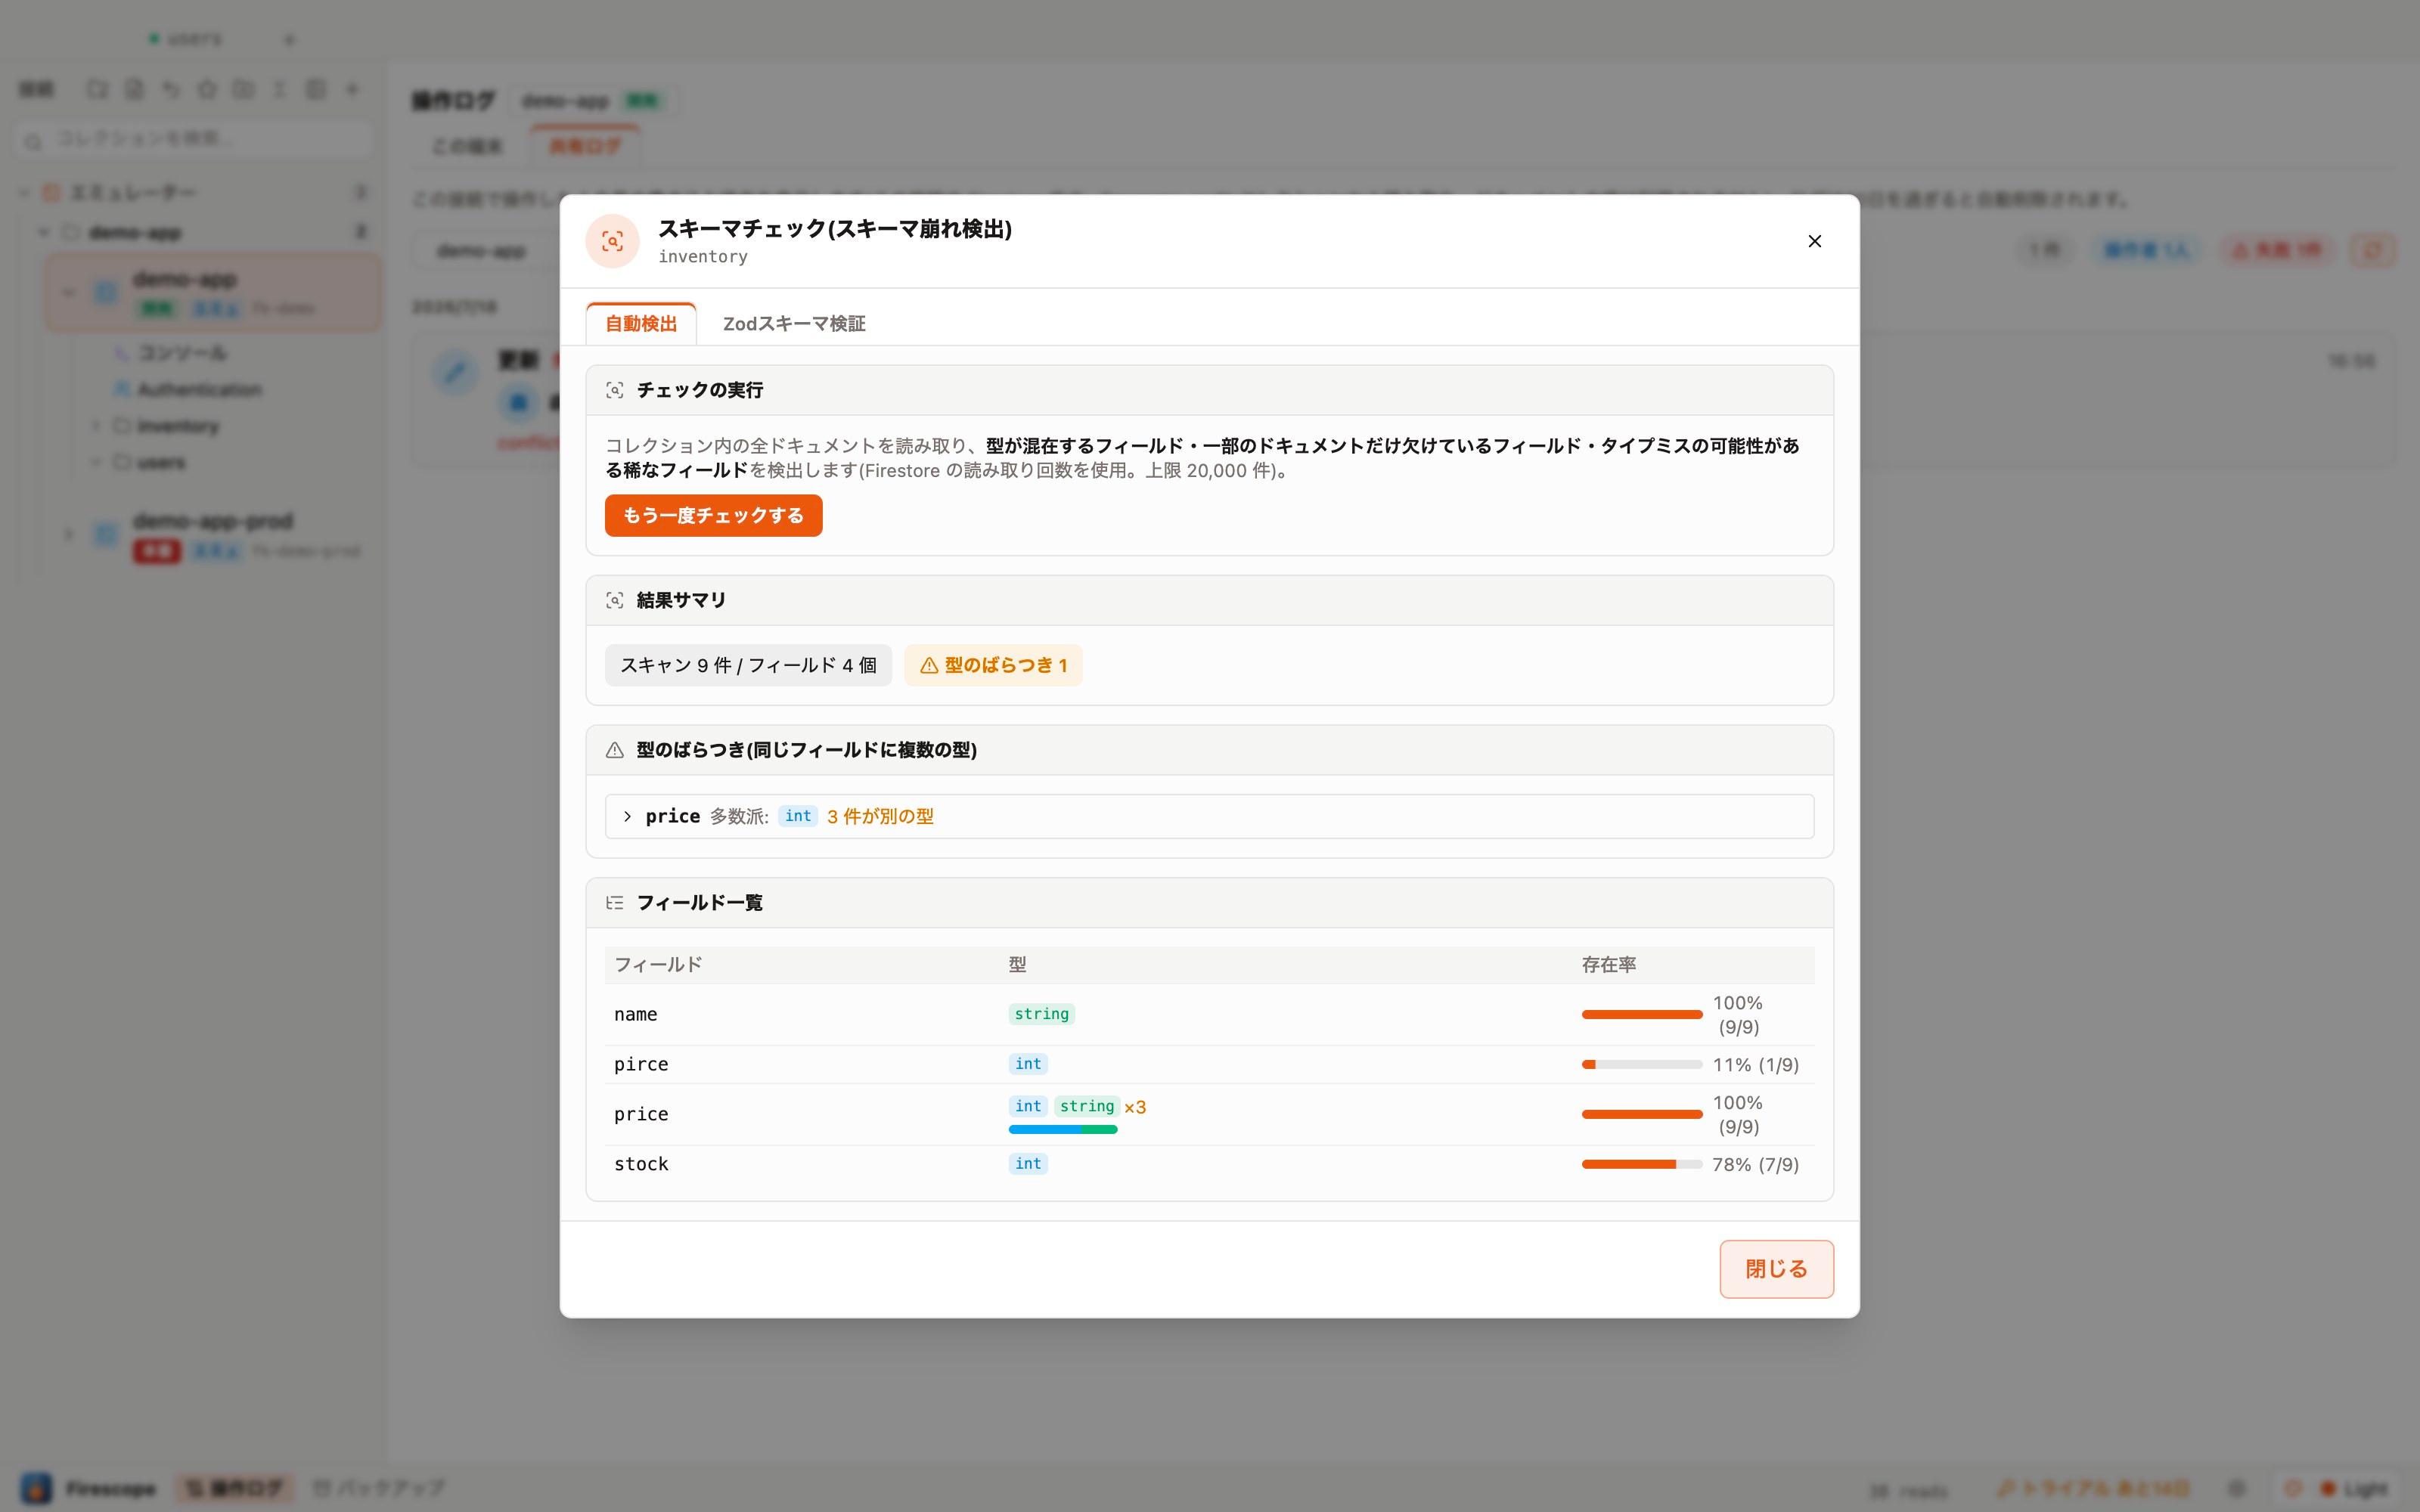
Right-click a collection → "Schema check…" to scan the whole collection and automatically detect fields with mixed types, fields missing from only some documents, and rare fields that may be typos (up to 20,000 documents).
- Fields missing together across the same set of documents are grouped into a single card. "Open all" checks every matching row, ready for a bulk action like deletion.
- Clicking a matching document's ID auto-scrolls the grid to that row and highlights it.
- Results persist even after closing the wizard, so you can go back and forth while reviewing documents as many times as needed.
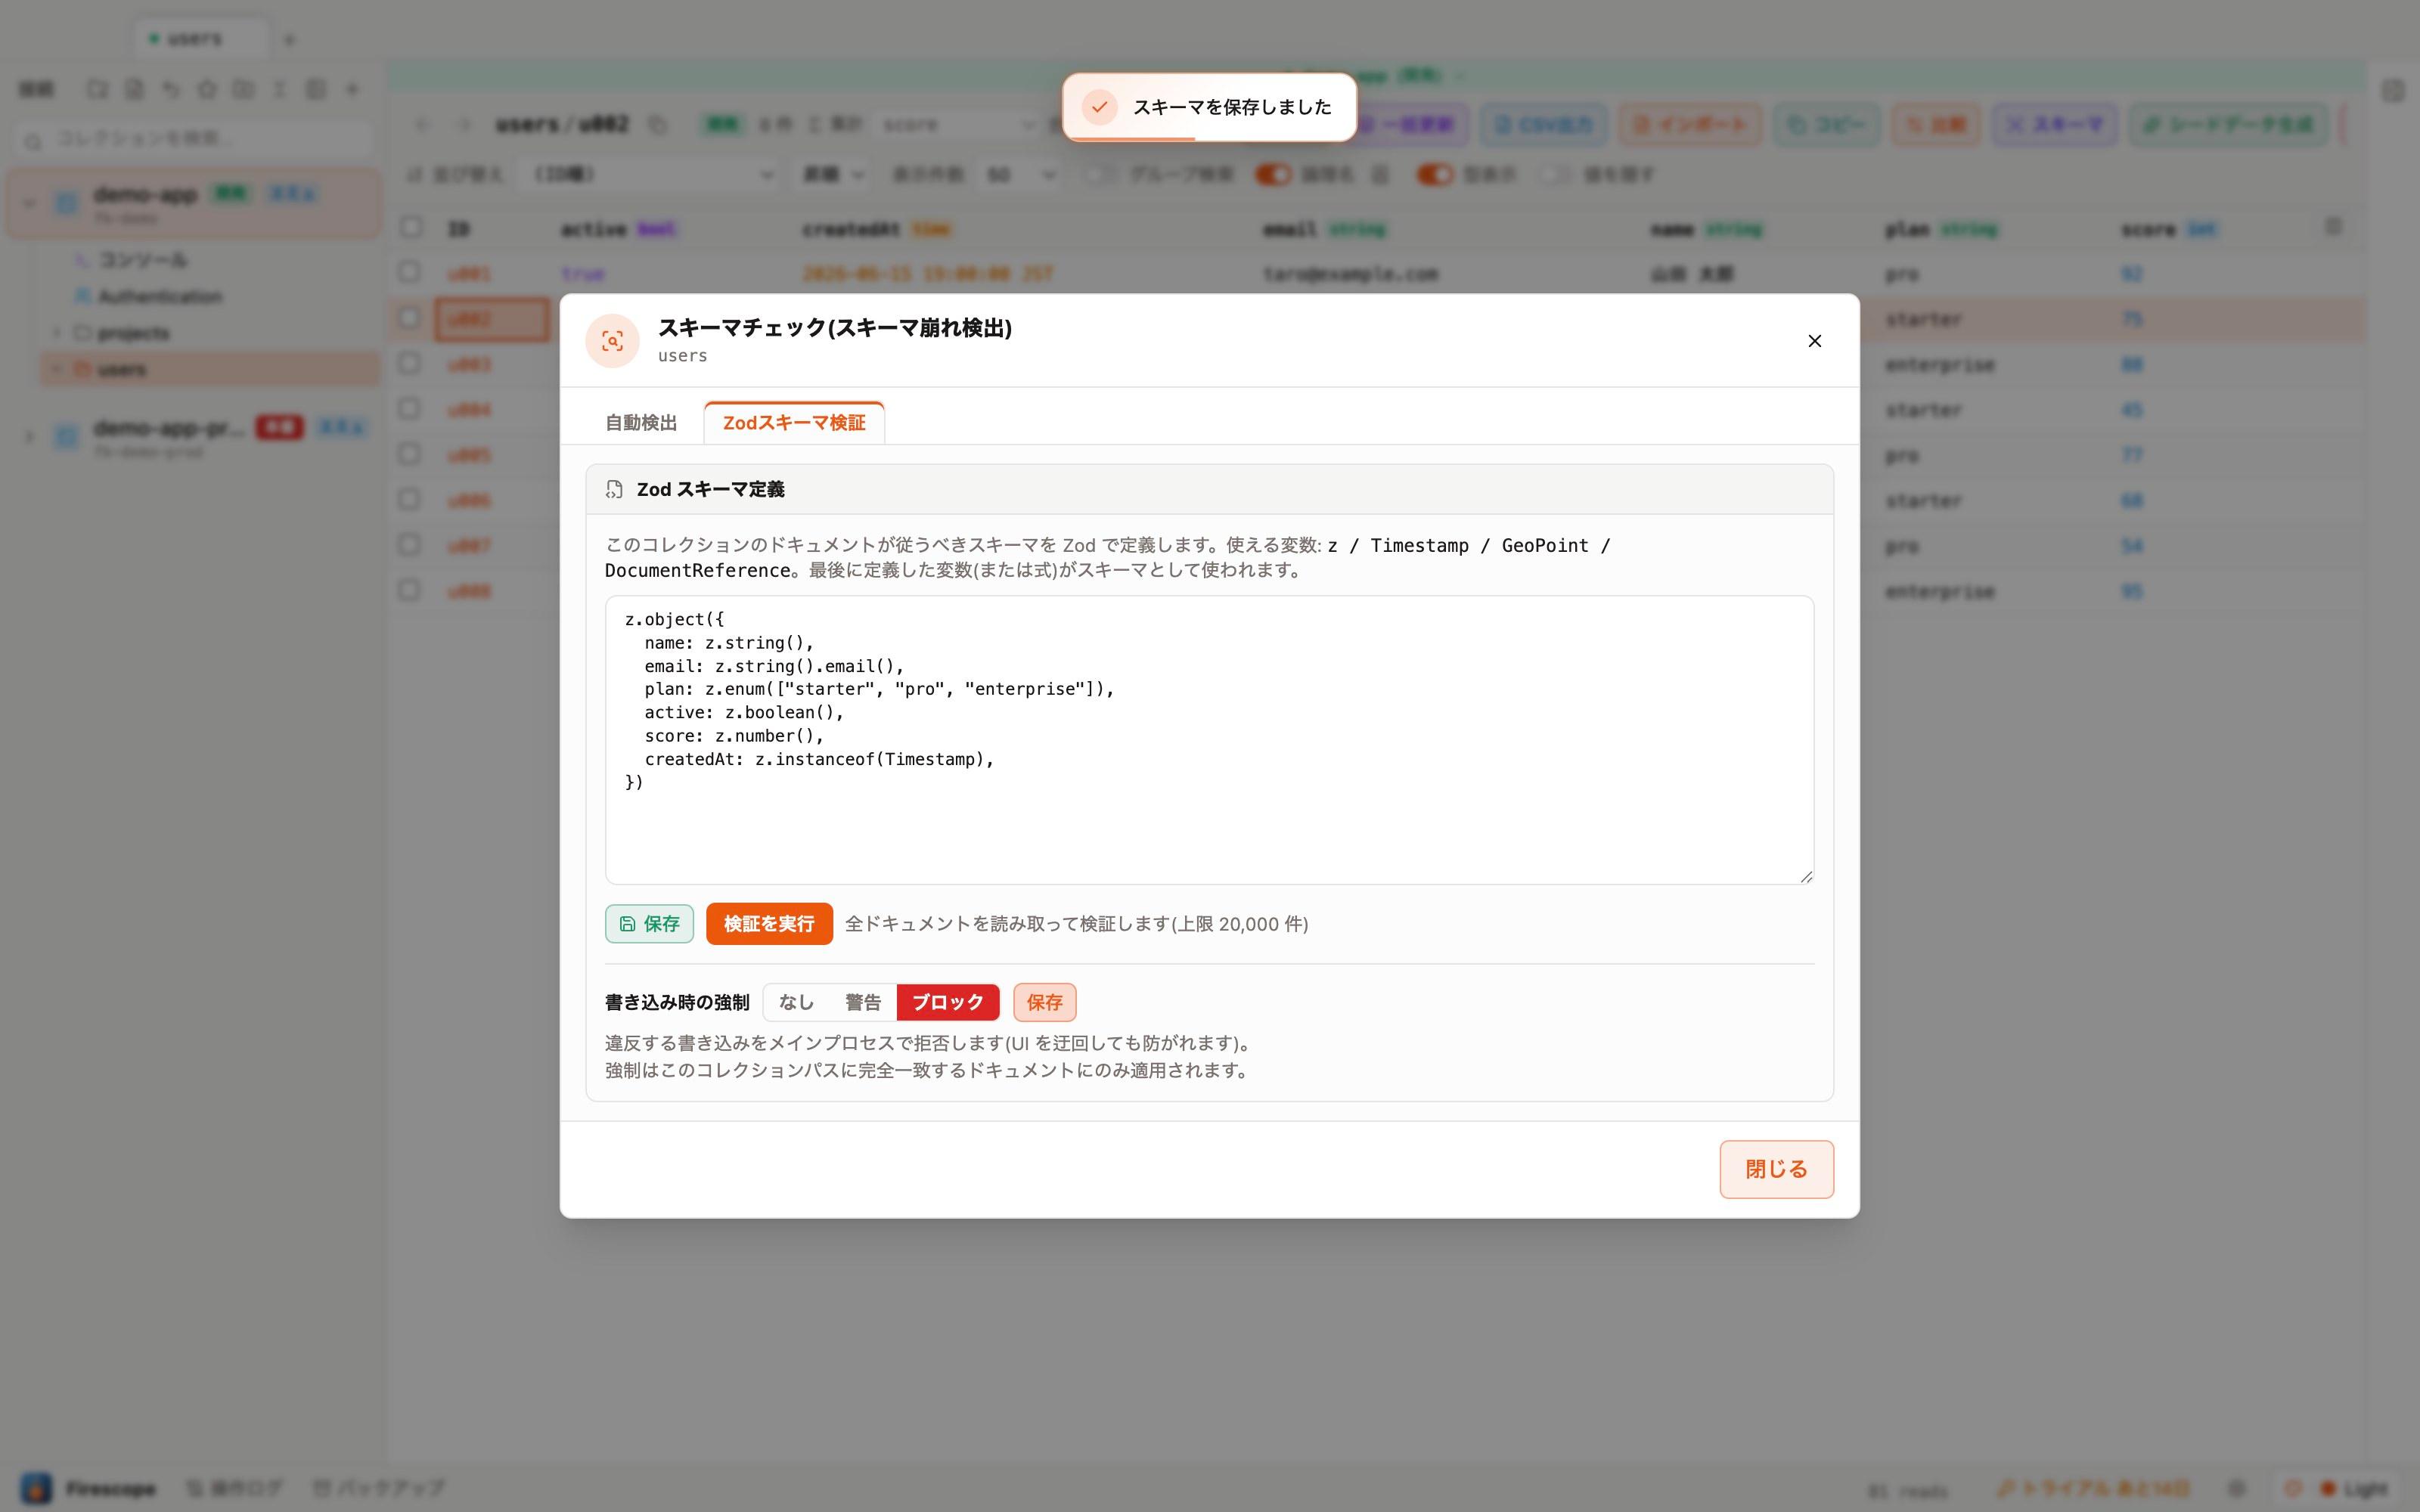
- The Zod schema validation tab lets you paste a Zod schema (TypeScript) to validate every document against it.
Enforcing writes with a schema
The "Zod schema validation" tab in Schema check can do more than validate — it can also enforce writes. Choose one of three levels — none / warn / block — and setting it to block makes the main process reject any write that violates the schema (this can't be bypassed even by going around the UI). Enforcement only applies to documents whose path exactly matches that collection.
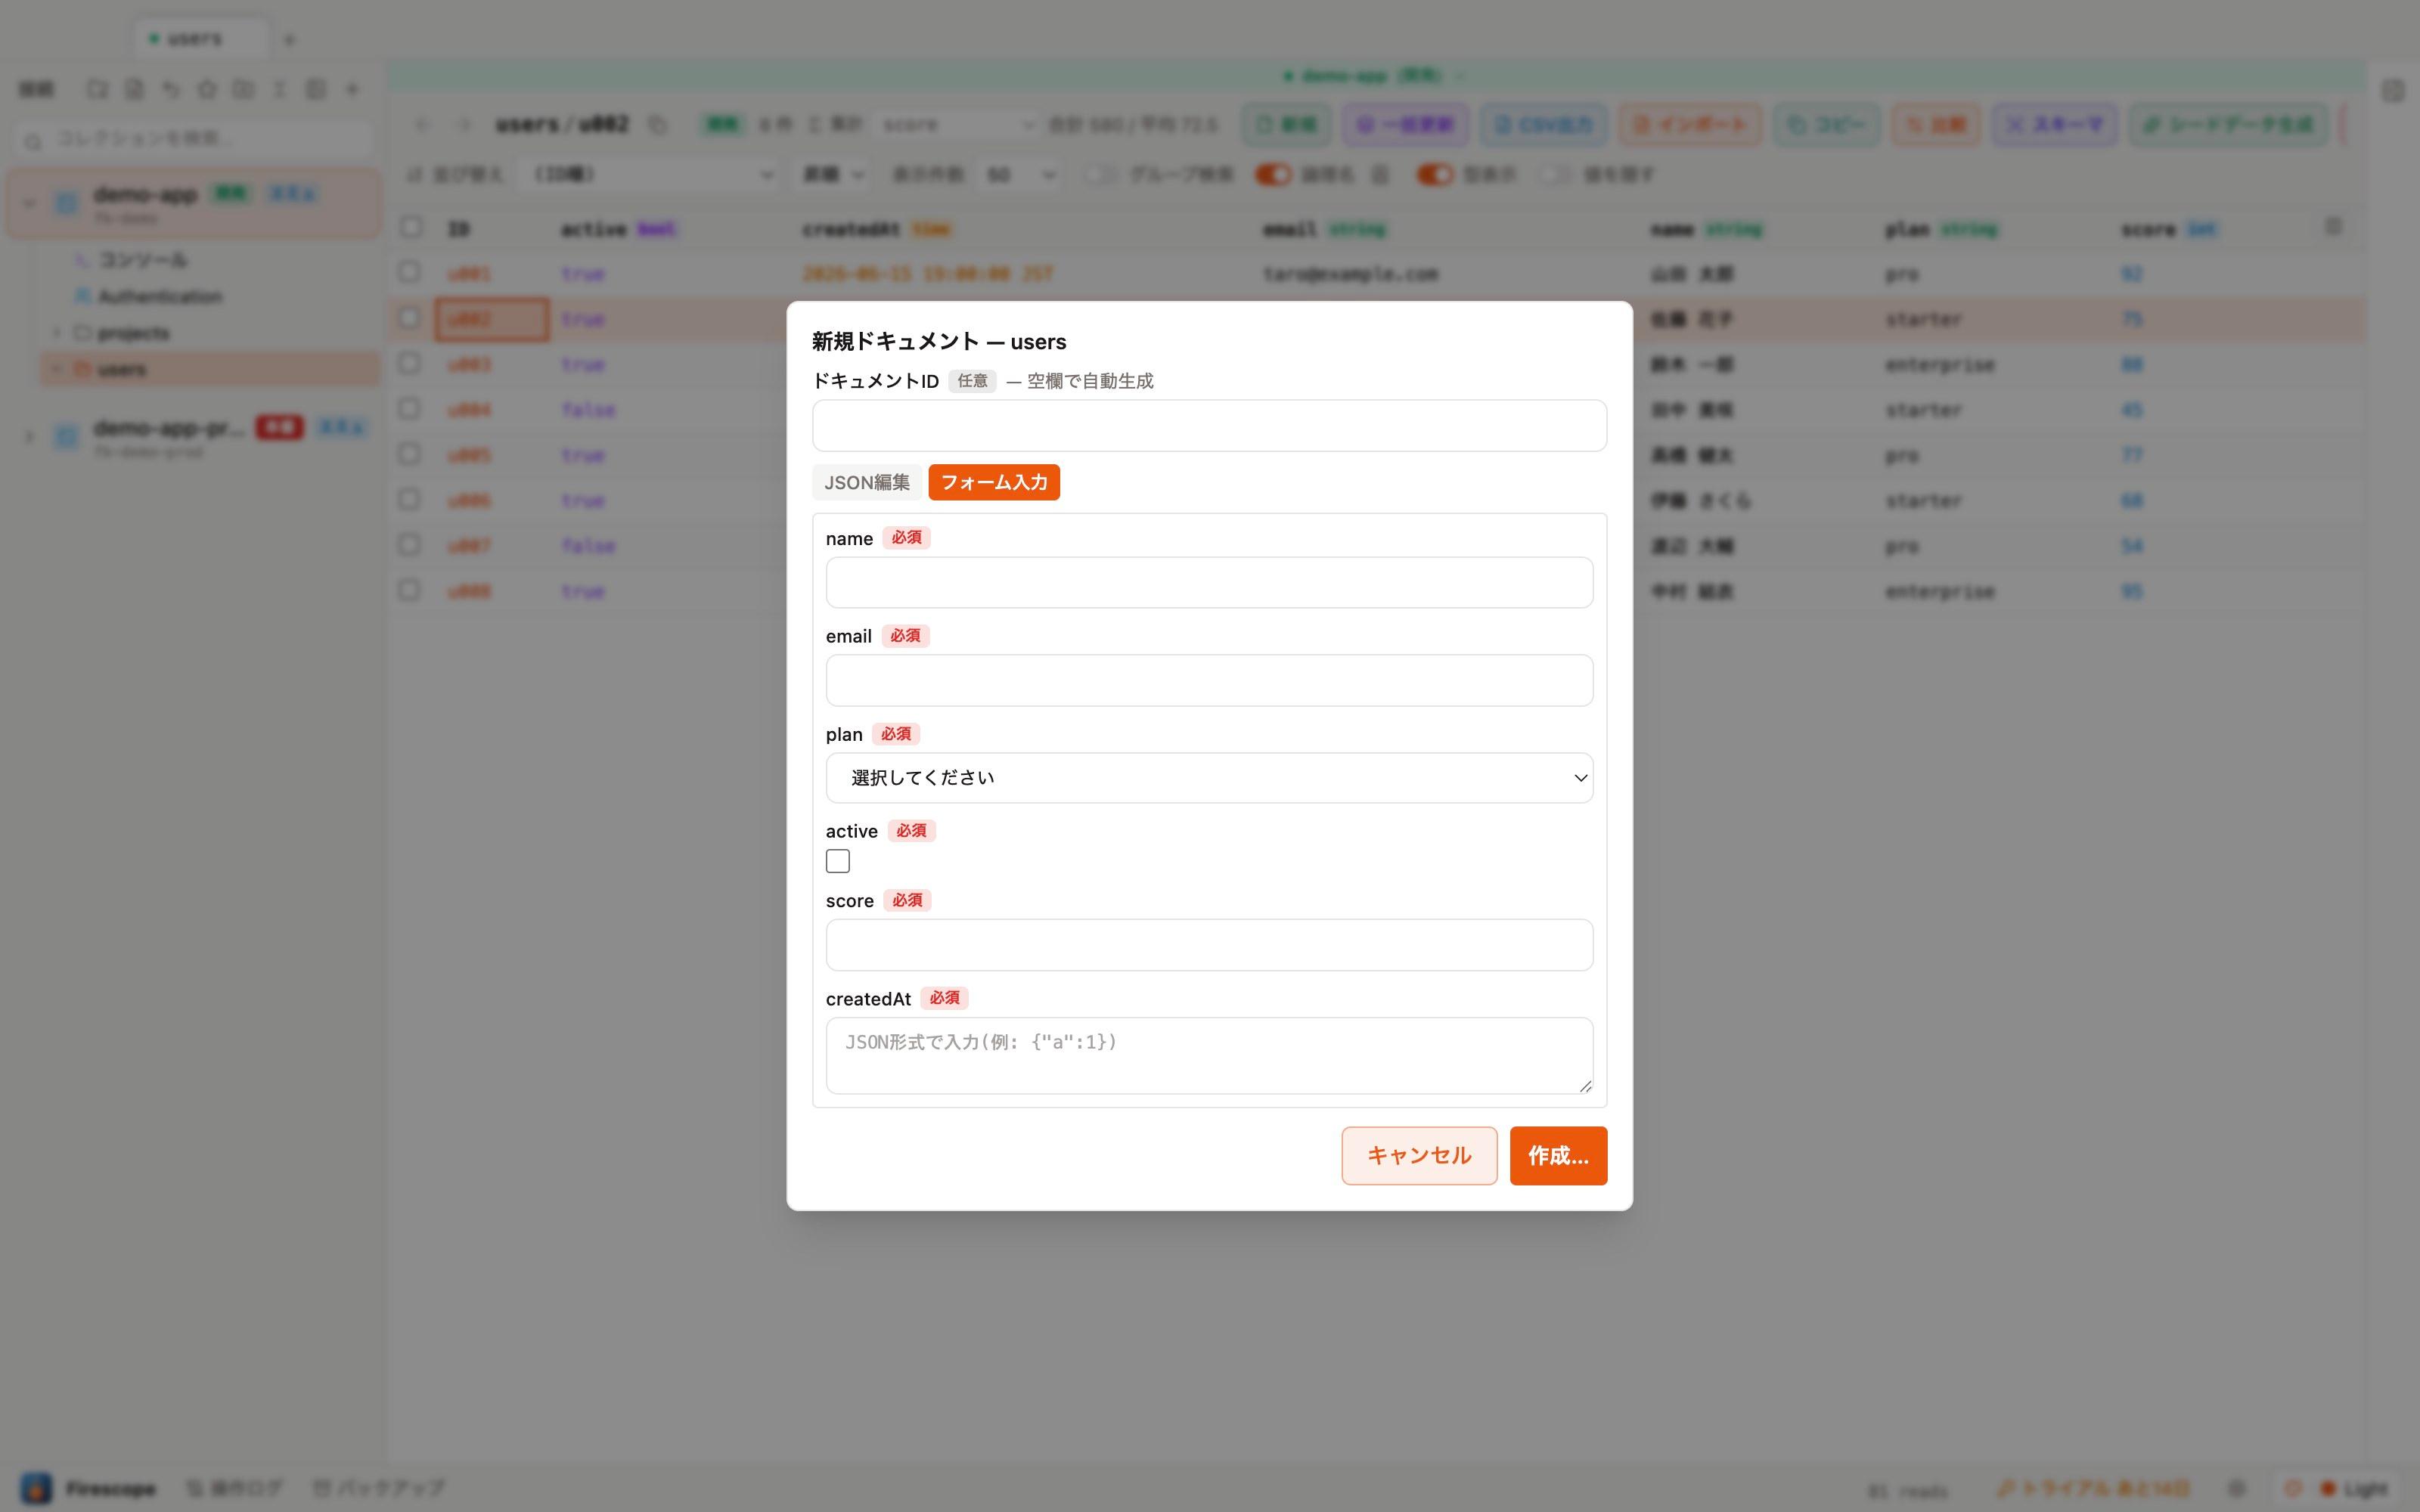
Once a Zod schema is registered, the "Form input" mode becomes available when creating a new document. A form is auto-generated from the schema's types, so you can create a document by filling in required fields without hand-writing JSON (for collections without a registered schema, a form can also be built from the schema check's type inference).
ER diagram export
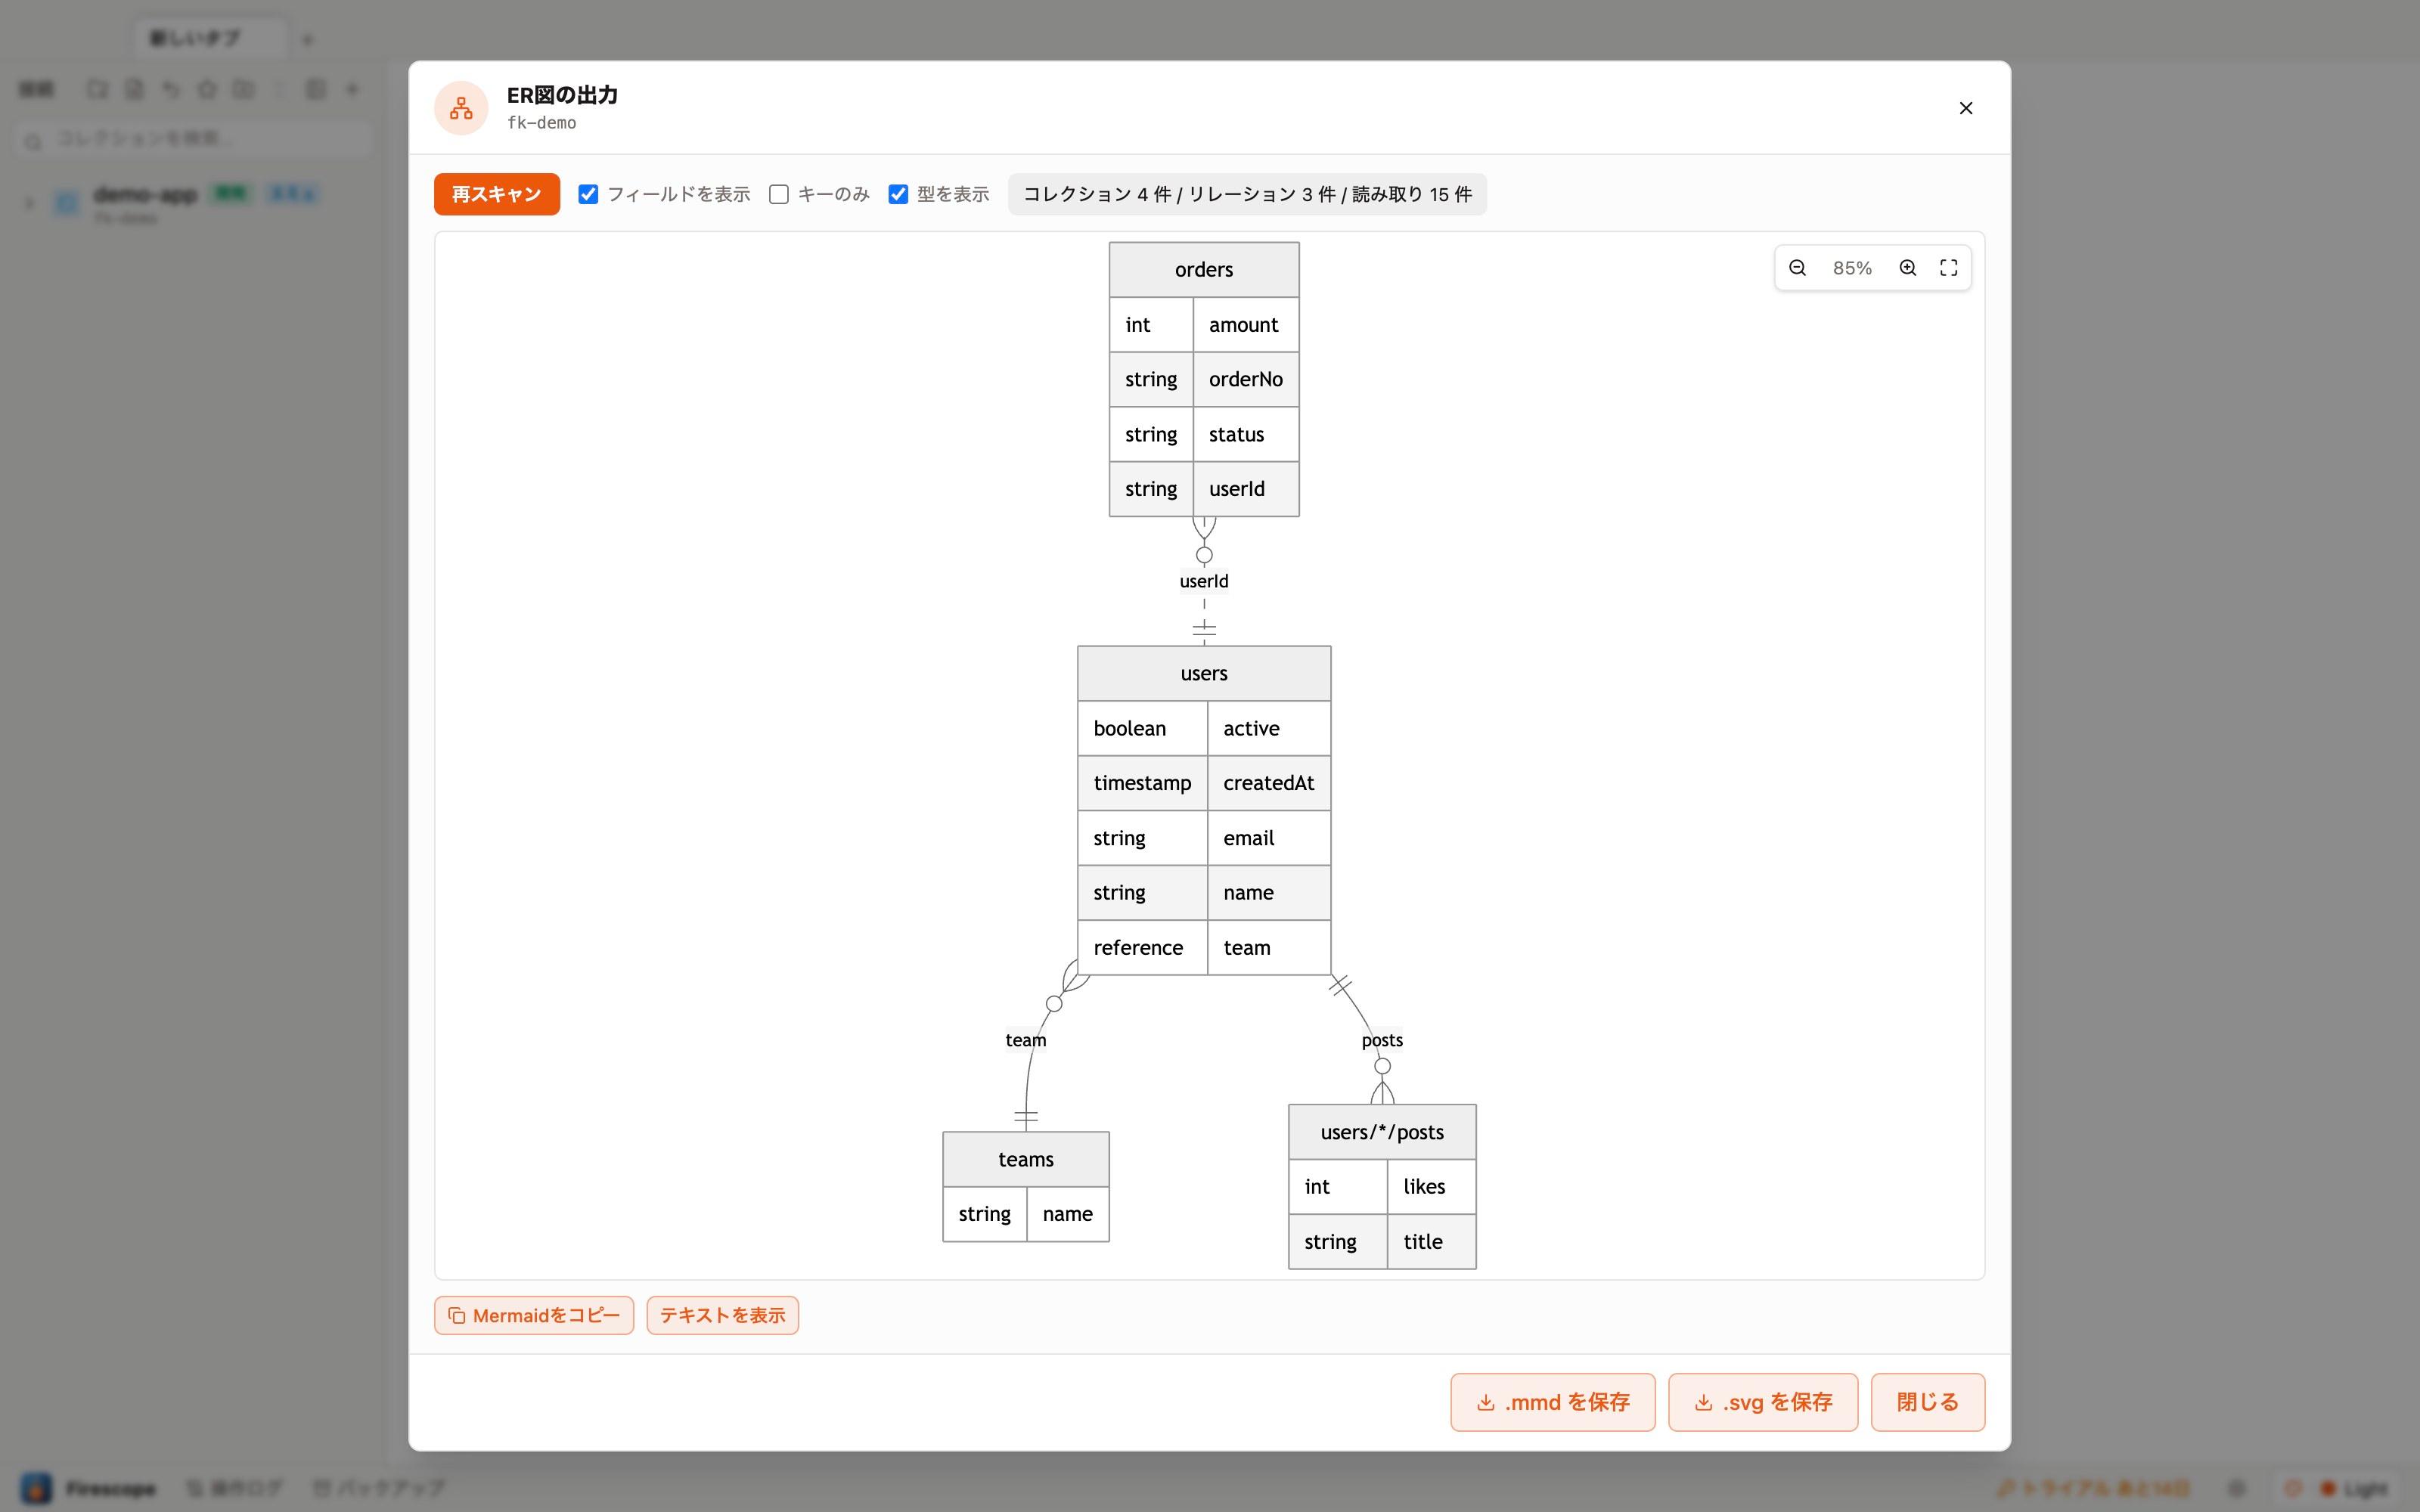
Right-click a connection in the sidebar → "Export ER diagram…" to sample every collection (up to 100 docs each) and generate an ER diagram automatically. Besides reference fields and subcollections, string-ID references like customerId are inferred from field names and drawn as dashed relationships.
- Toggle "Show fields", "Keys only", "Show types" and "Include logical names" instantly — every variant is pre-rendered.
- Pinch or Ctrl+wheel to zoom, drag to pan, one click to fit the whole diagram.
- Copy the Mermaid text or save as .mmd / .svg — paste it straight into GitHub or Notion.
- Lines to parents with many subcollections are omitted from the diagram for readability (they remain in the Mermaid text).
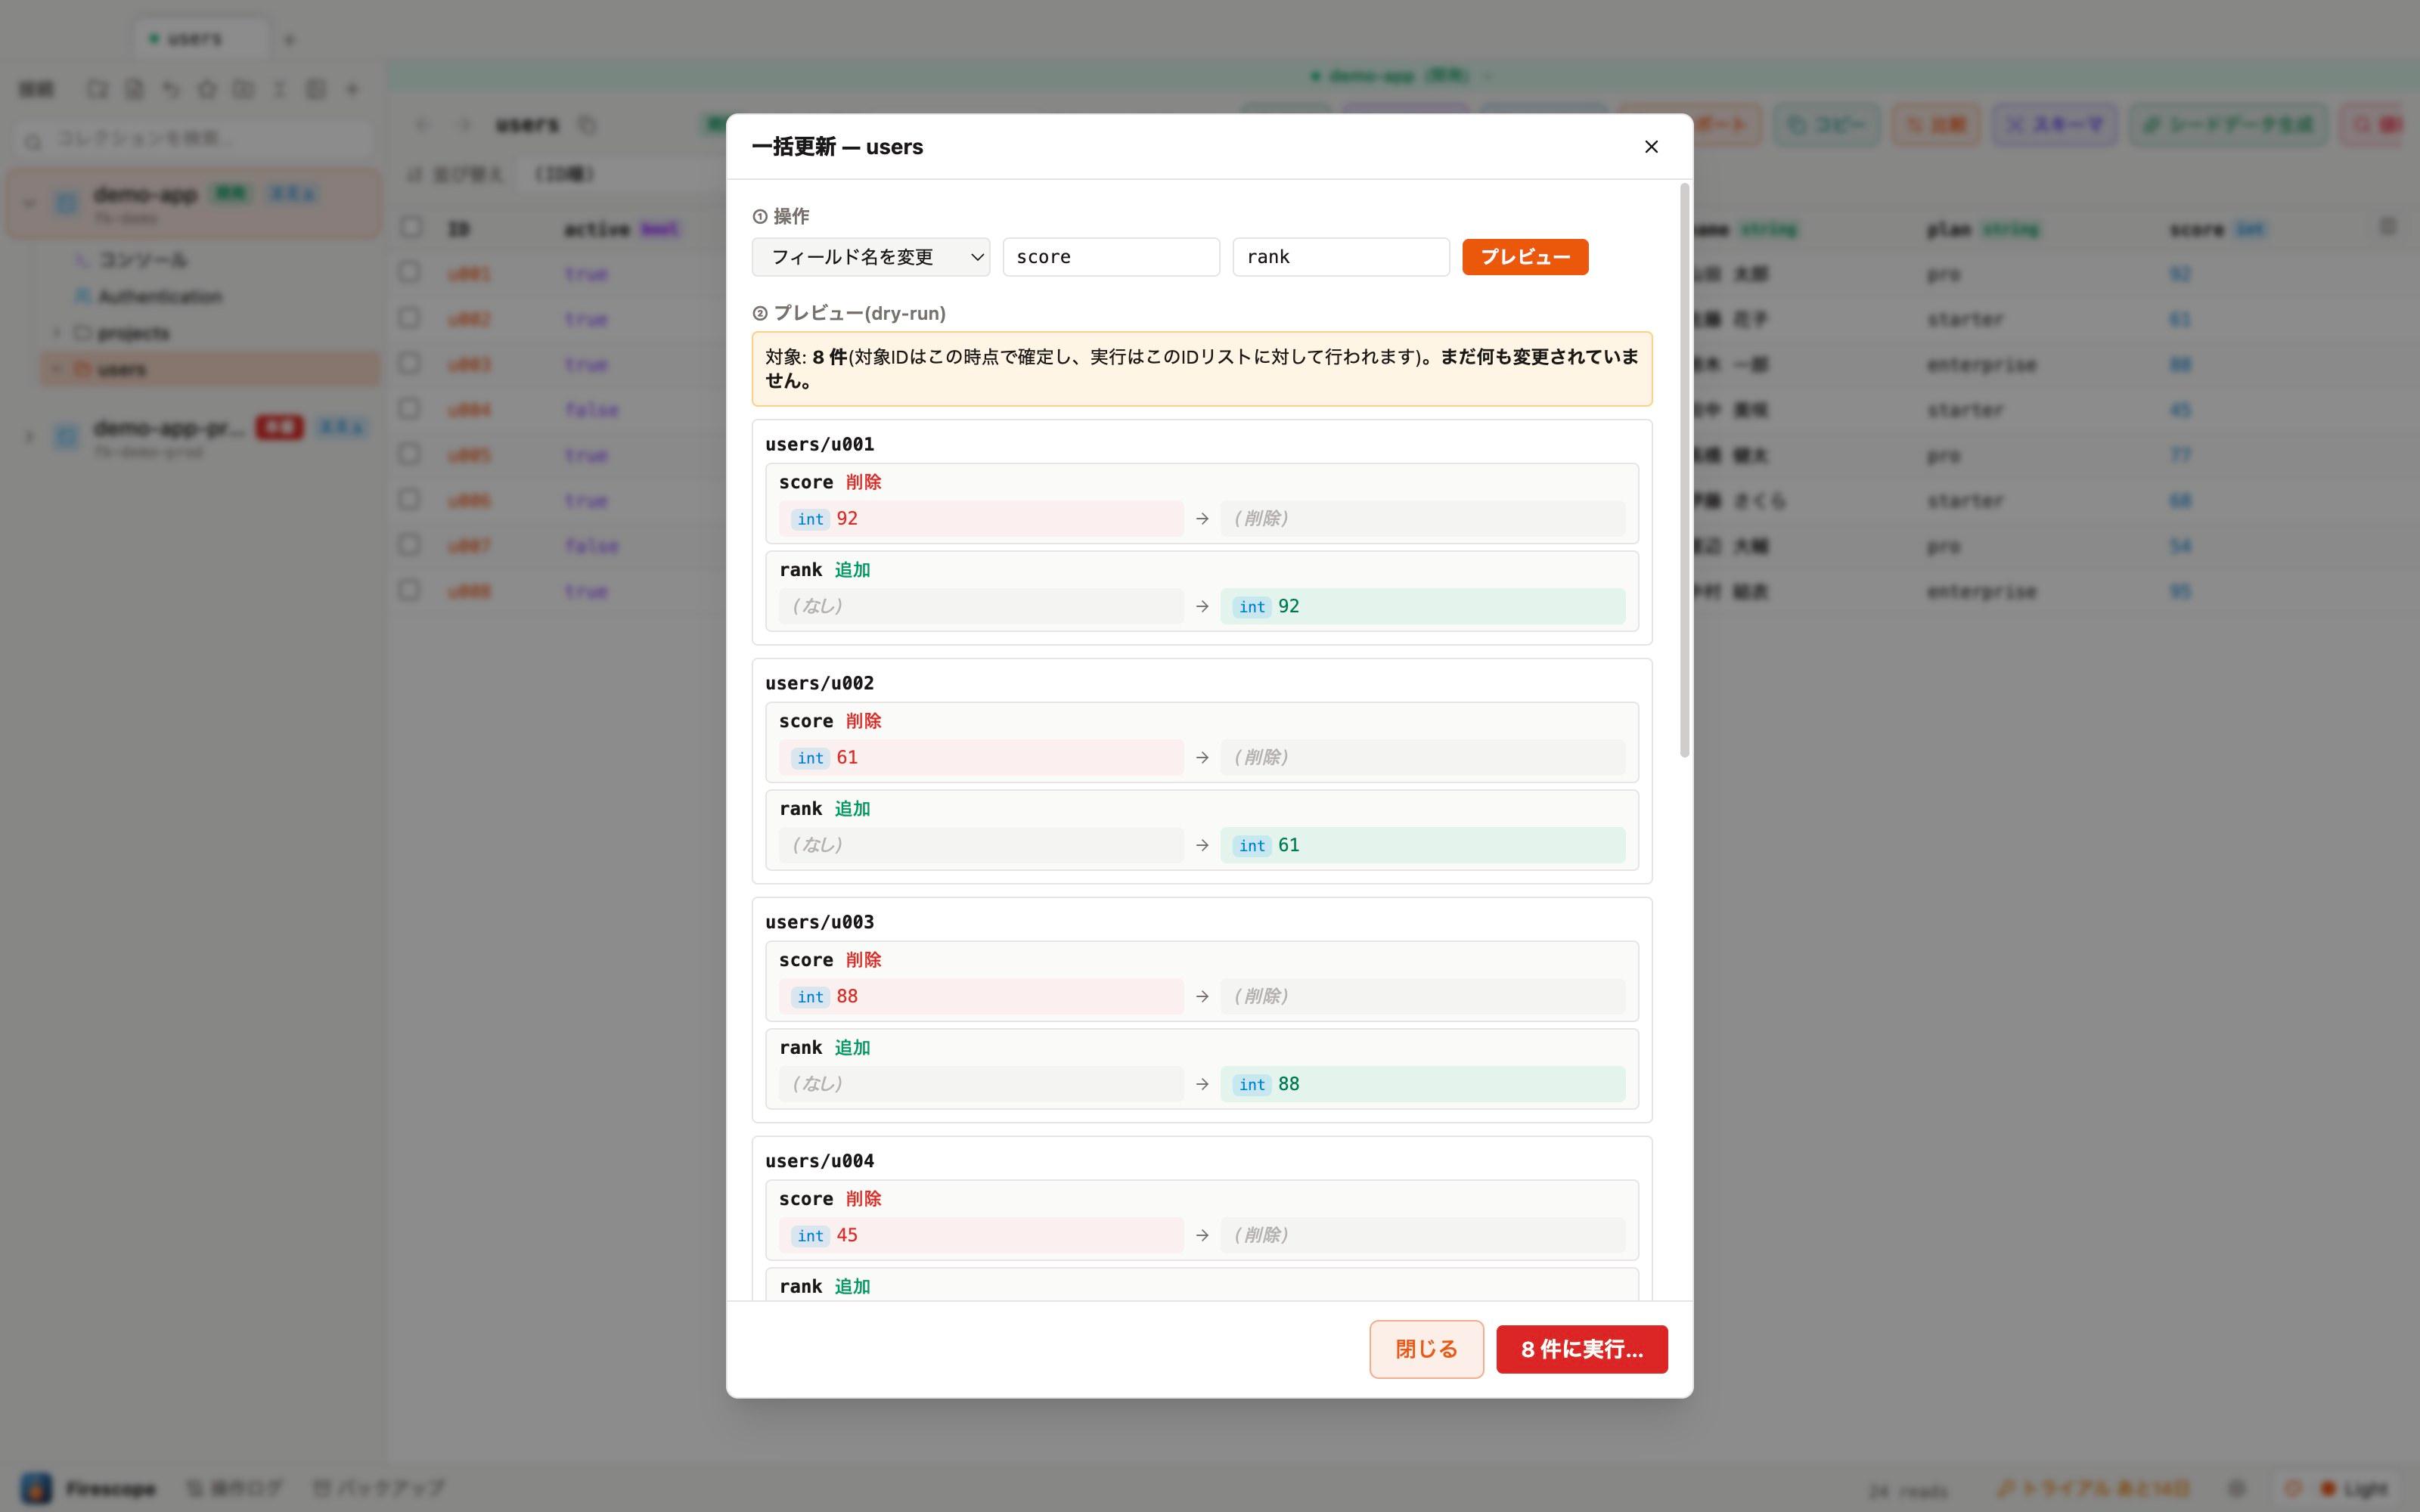
Data migration
"Bulk update" supports not just bulk field sets but also renaming fields and converting types. Always review the full diff in a dry-run preview before running it.
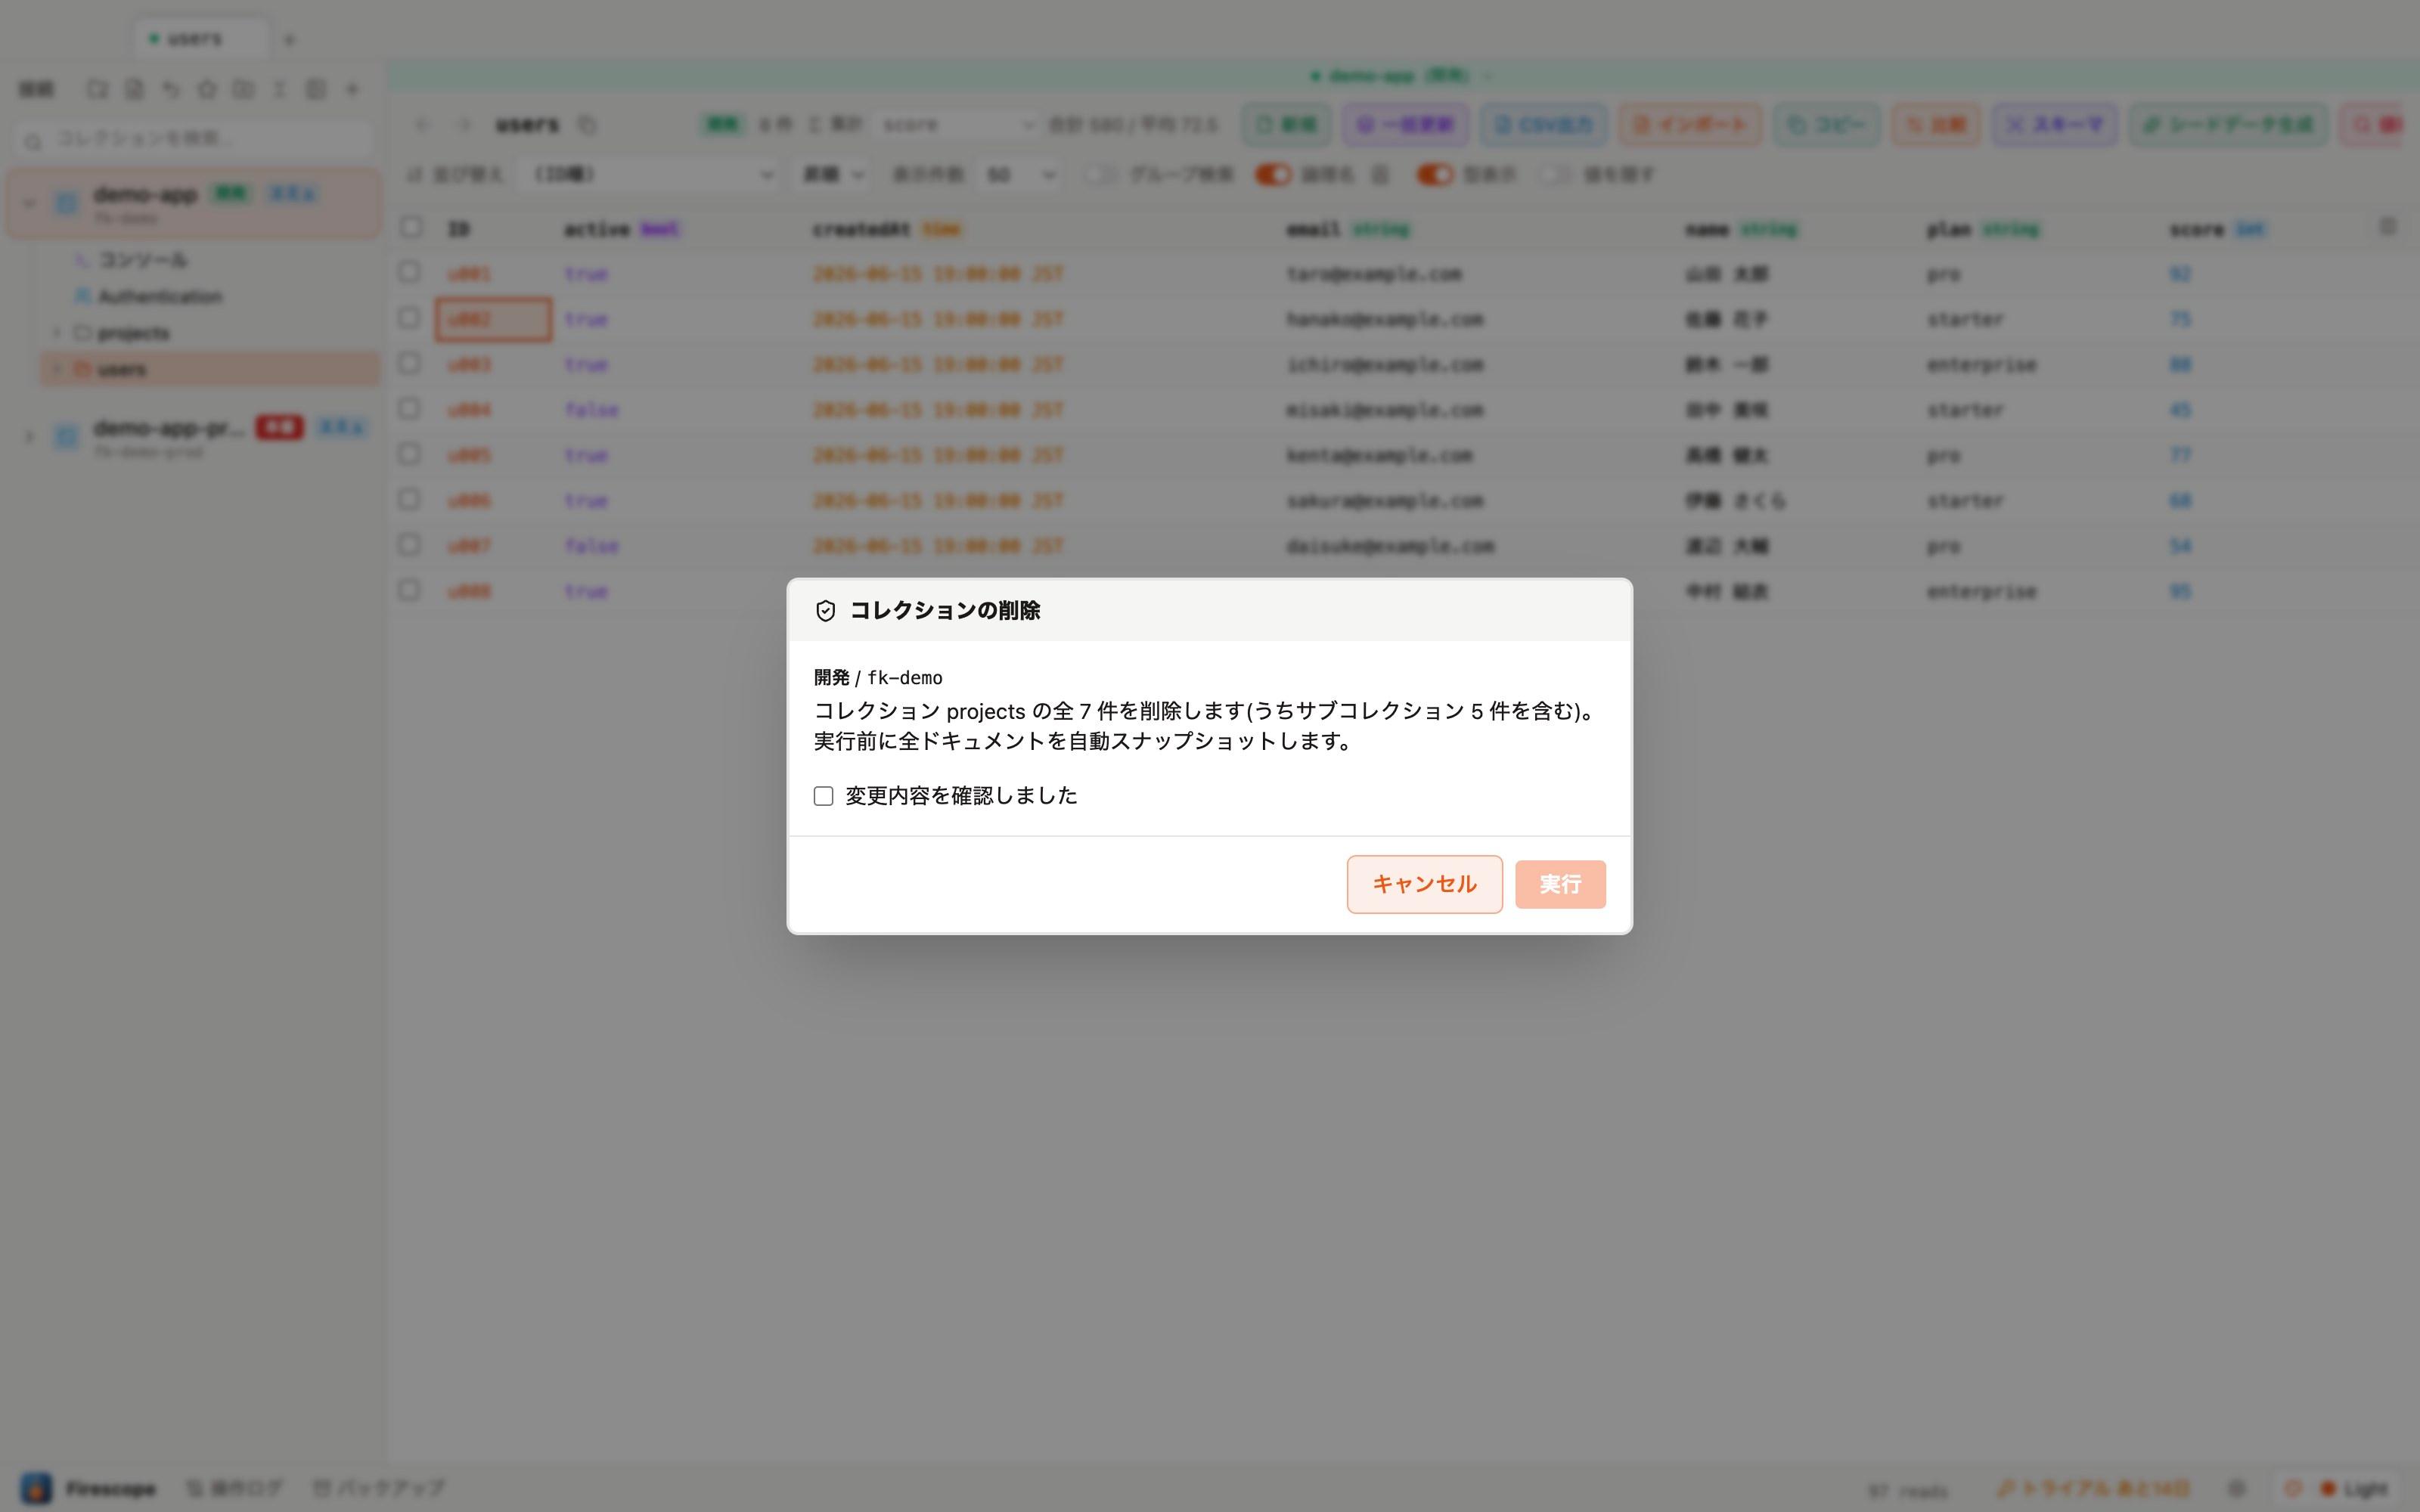
Right-click a collection → "Delete collection…" recursively deletes subcollections too. The confirmation dialog's count includes subcollection documents, and affected documents are automatically snapshotted before execution.
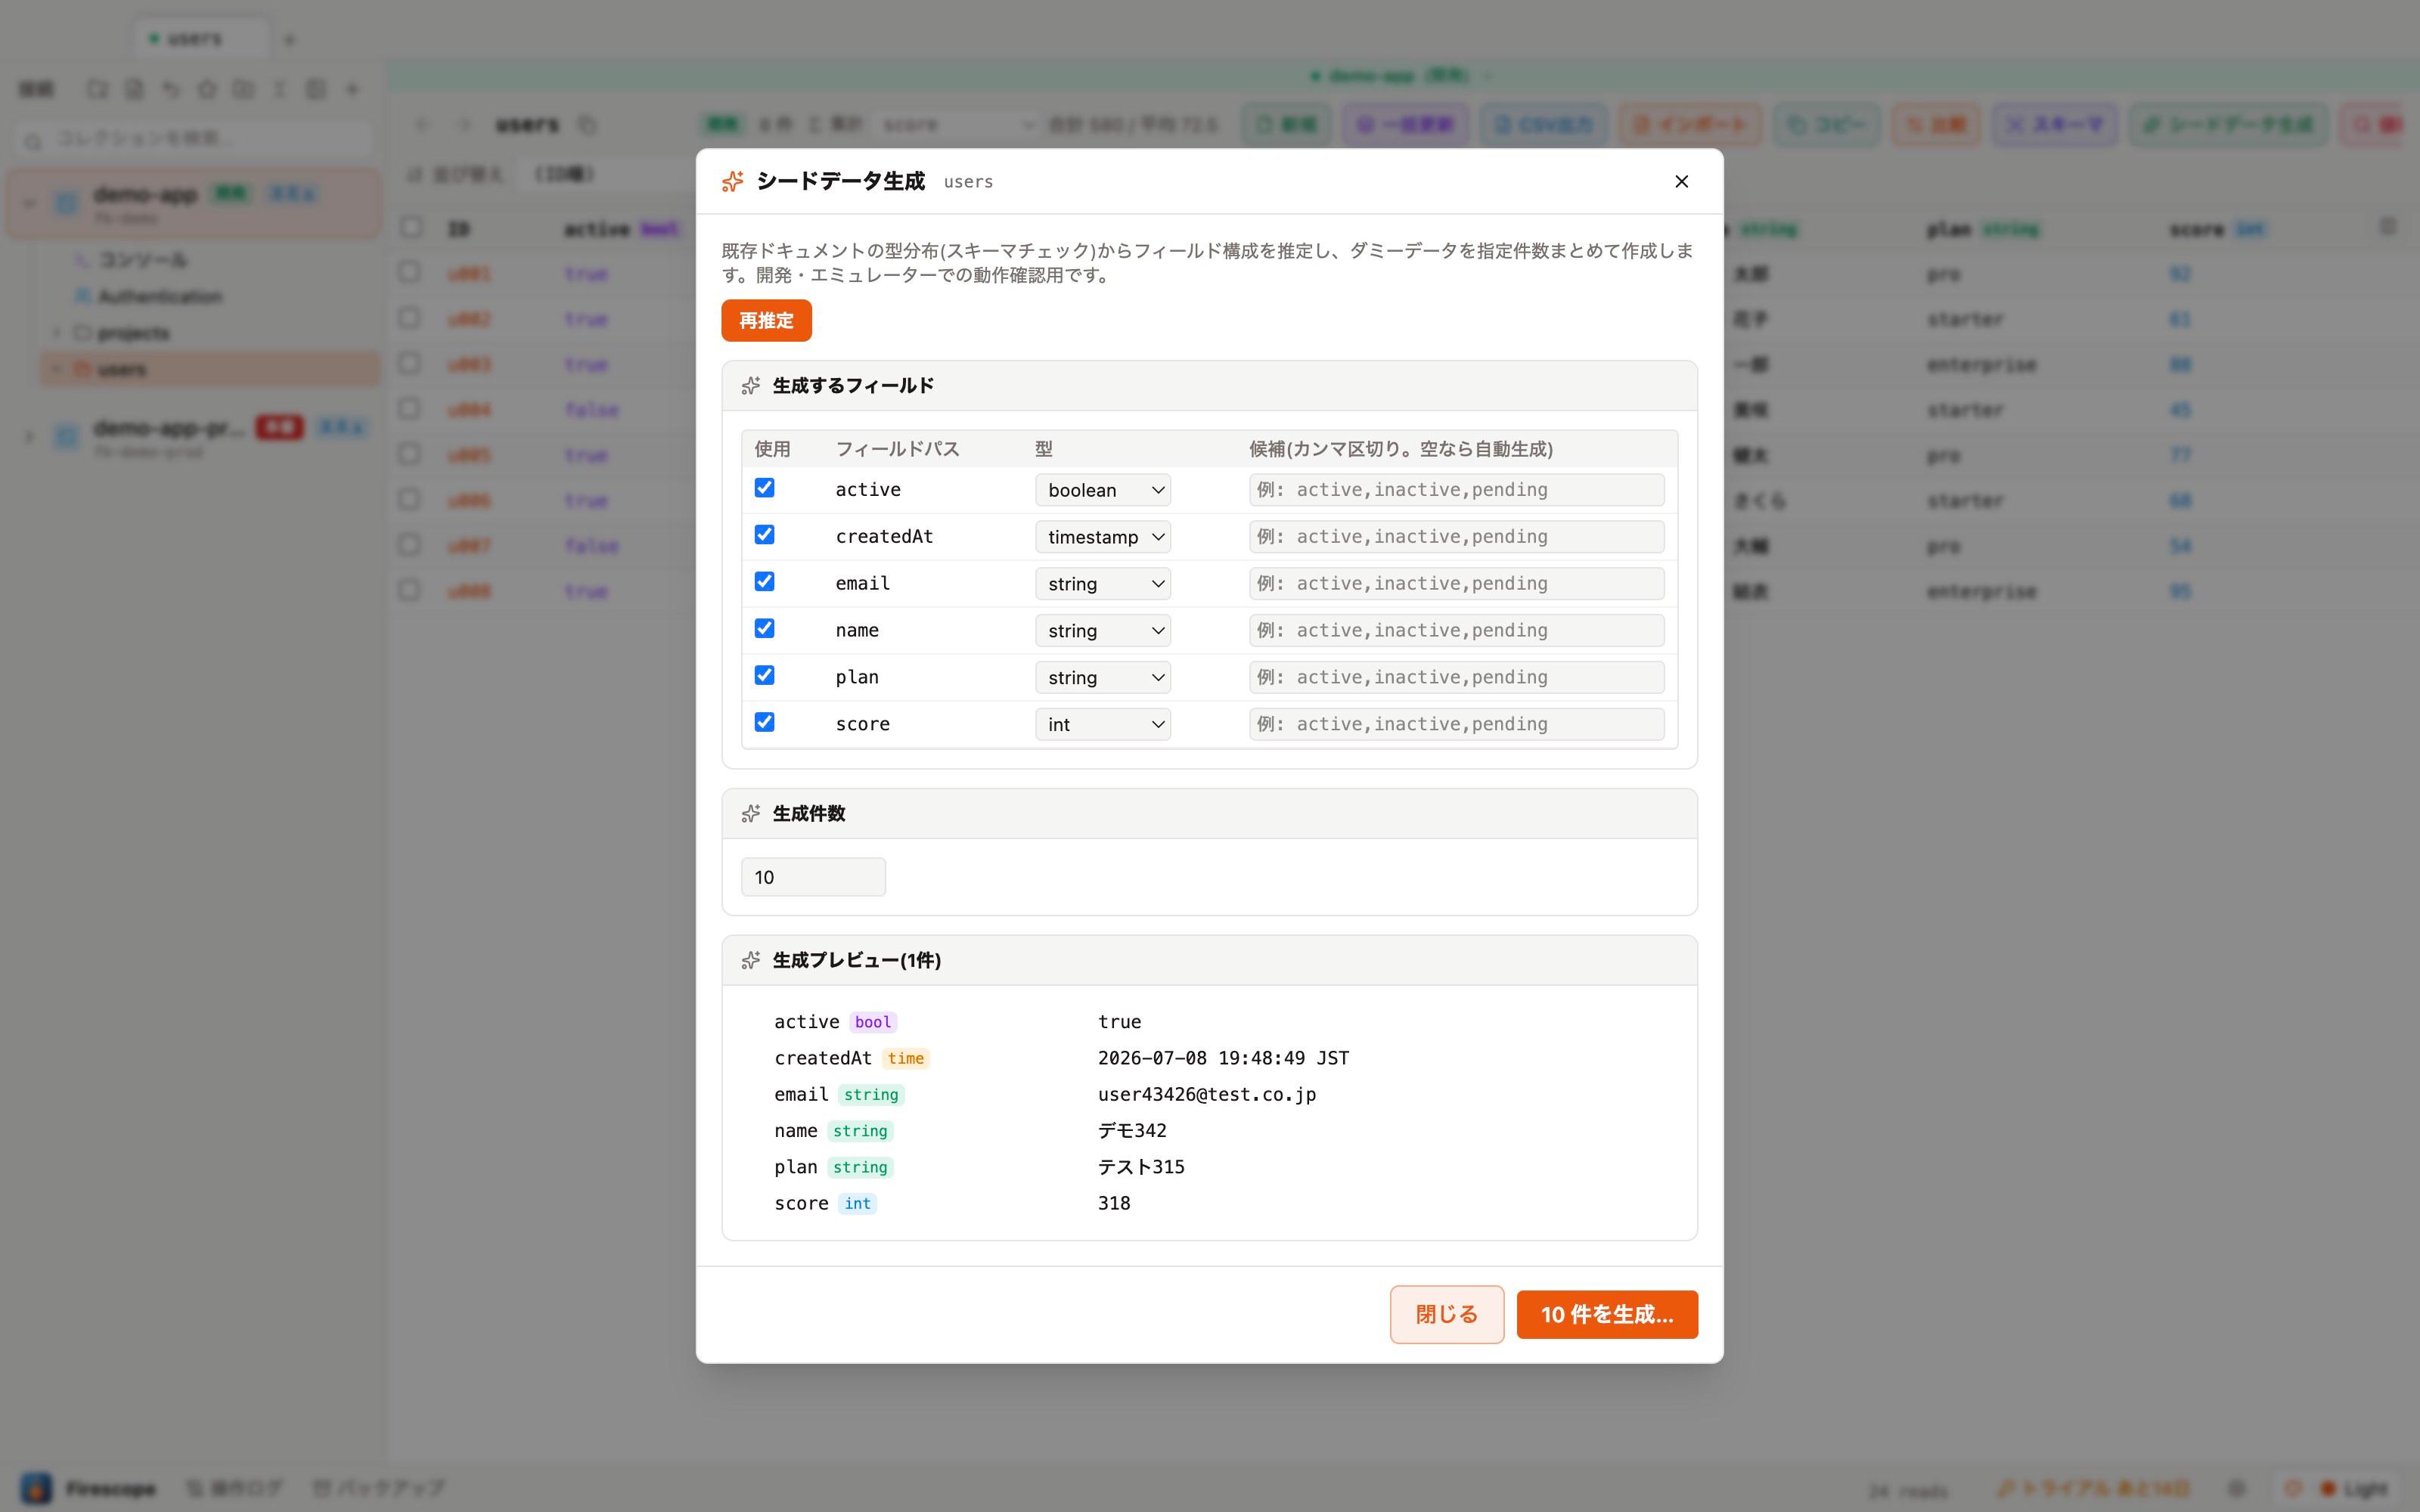
"Generate seed data" infers a field layout from the type distribution of existing documents (schema check) and creates a batch of dummy documents up to a specified count. Intended for development and emulator testing.
Comparing and copying environments
Compare with another environment
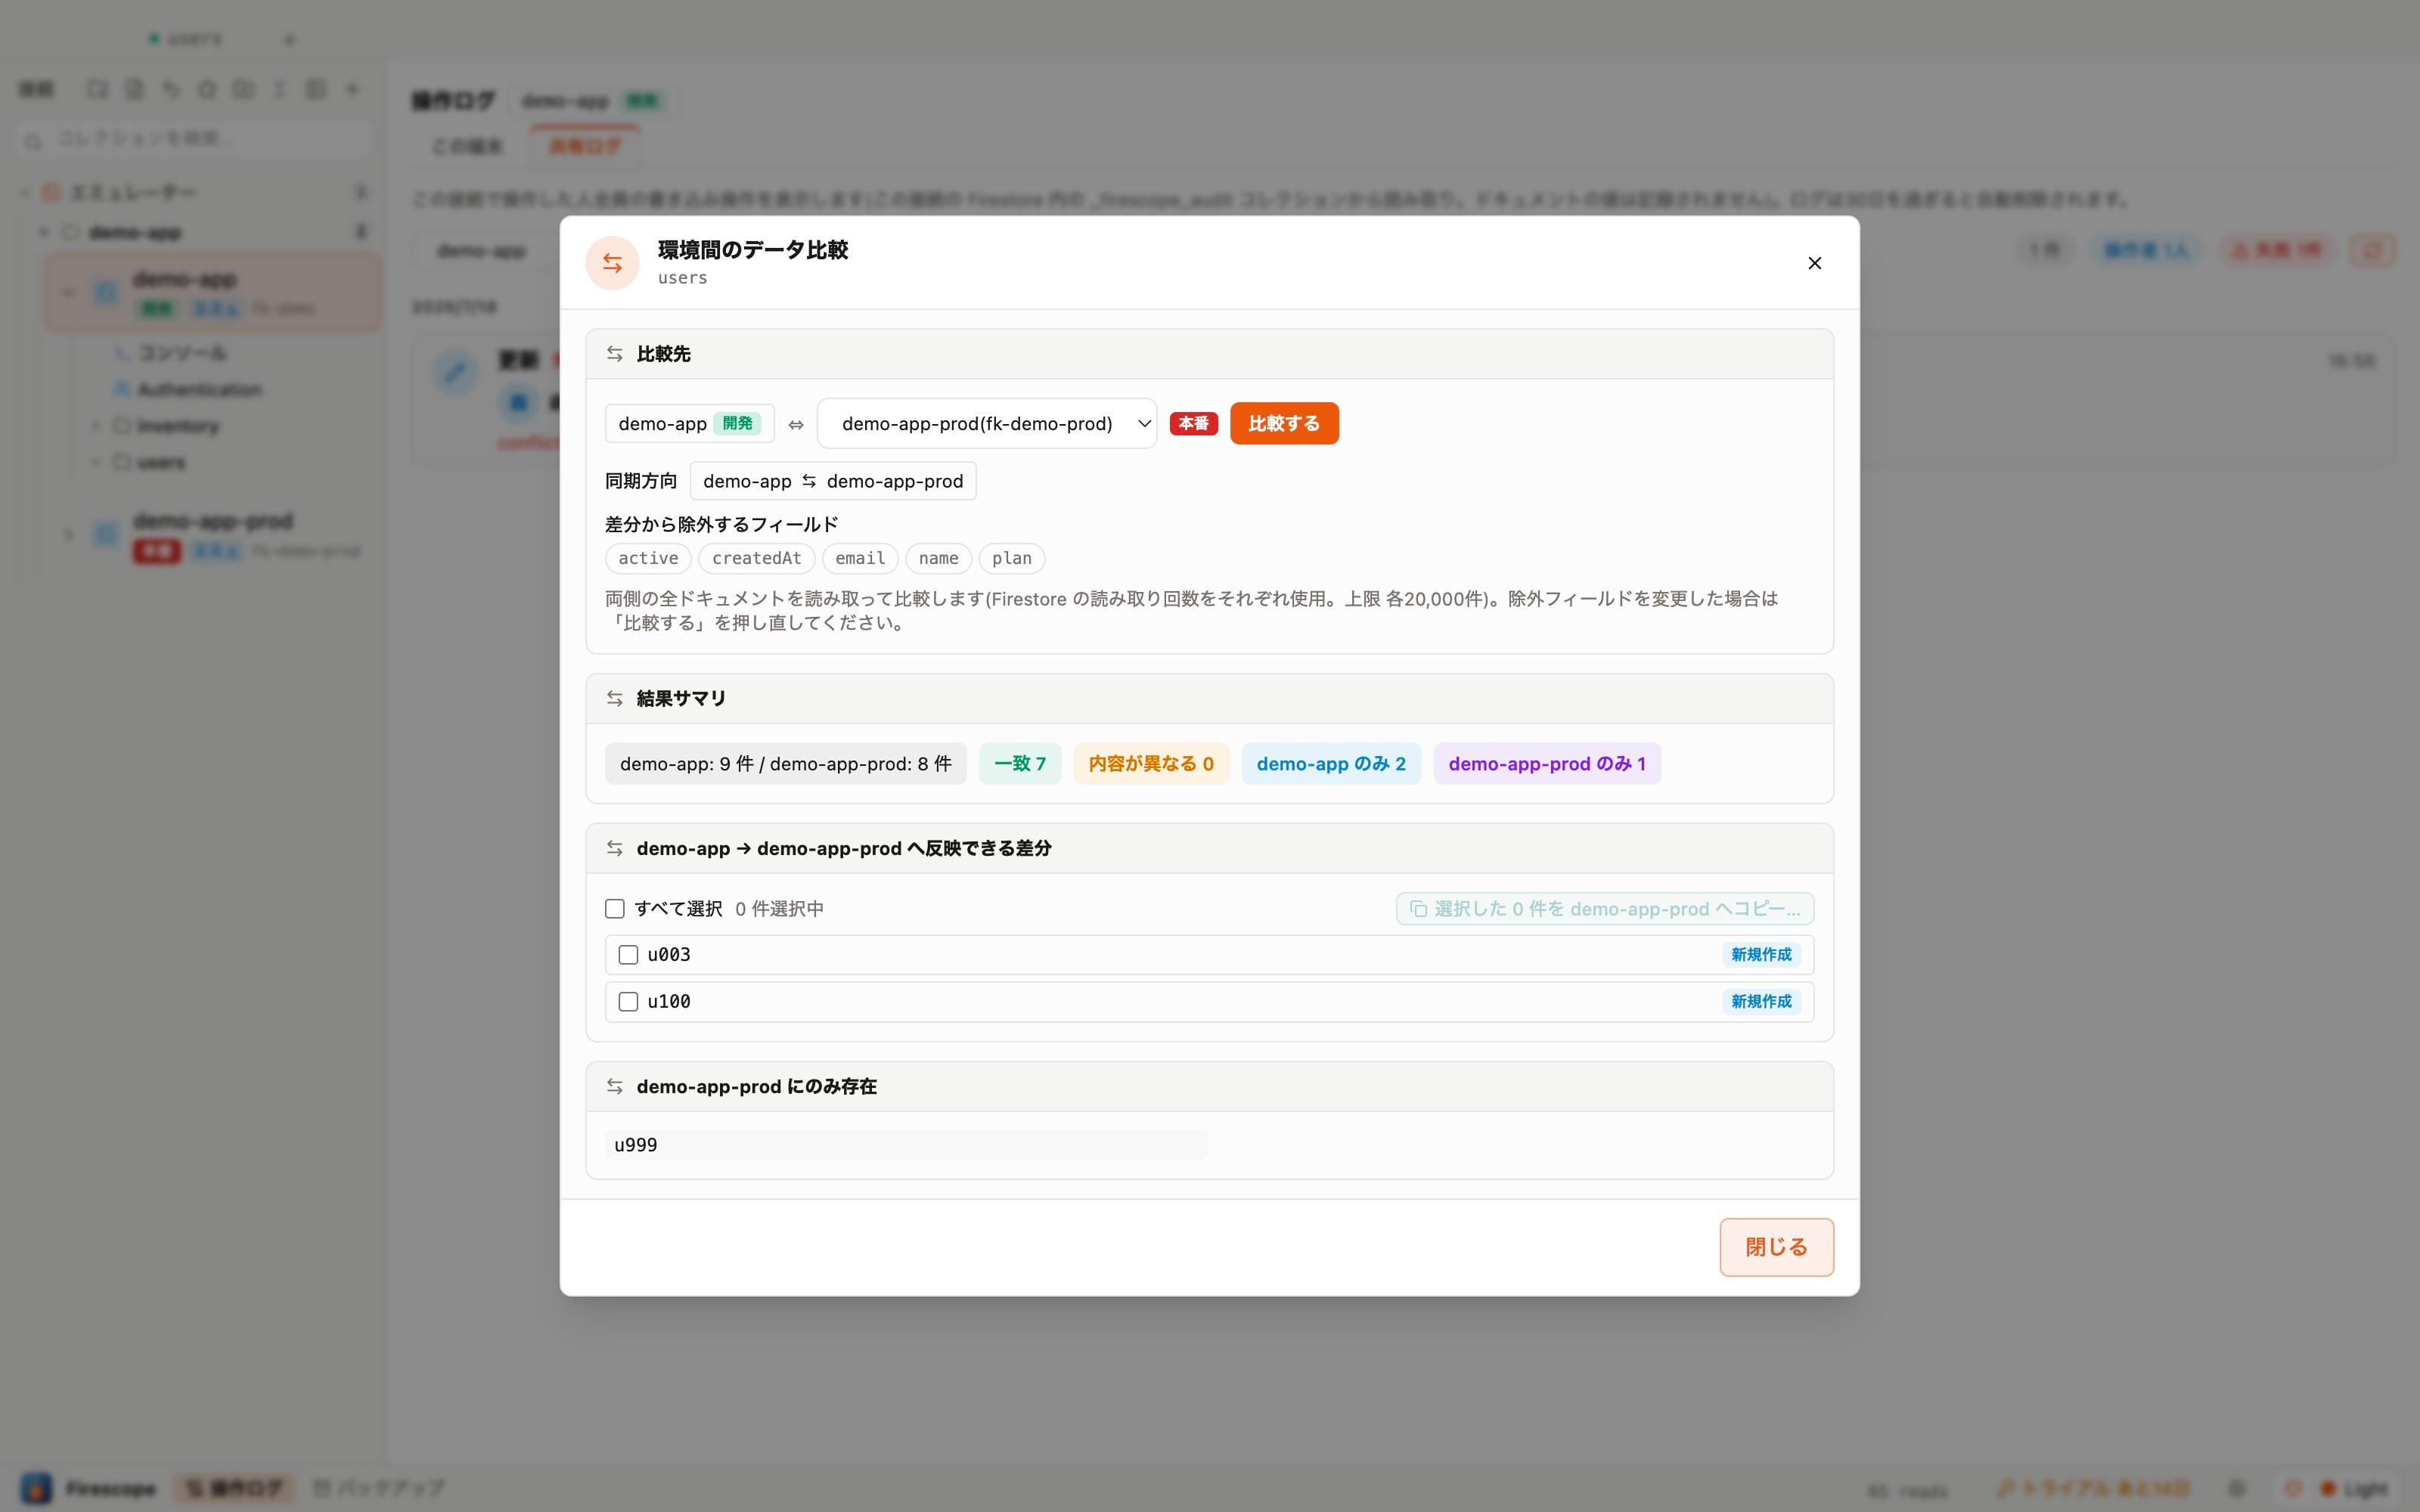
Right-click a collection → "Compare with another environment…" to match up the same-named collection across two environments (e.g. development vs. production). Differences (added / removed / changed) are listed per document and per field.
- You can exclude fields such as updatedAt from the comparison.
- The diff results can be exported as CSV.
Copy to another environment
"Copy to another environment…" duplicates a collection into another connection (environment). It previews the count and whether anything will be overwritten before running, and writes to production still go through the usual strict confirmation guard.
Comparing and diffing
Comparing environments also supports diff sync: pick differences (documents that differ or exist on only one side) and apply them directly to the destination. The sync direction is suggested based on the connections' environment labels, and applying it still goes through the usual safety pipeline (confirmation, automatic backup).
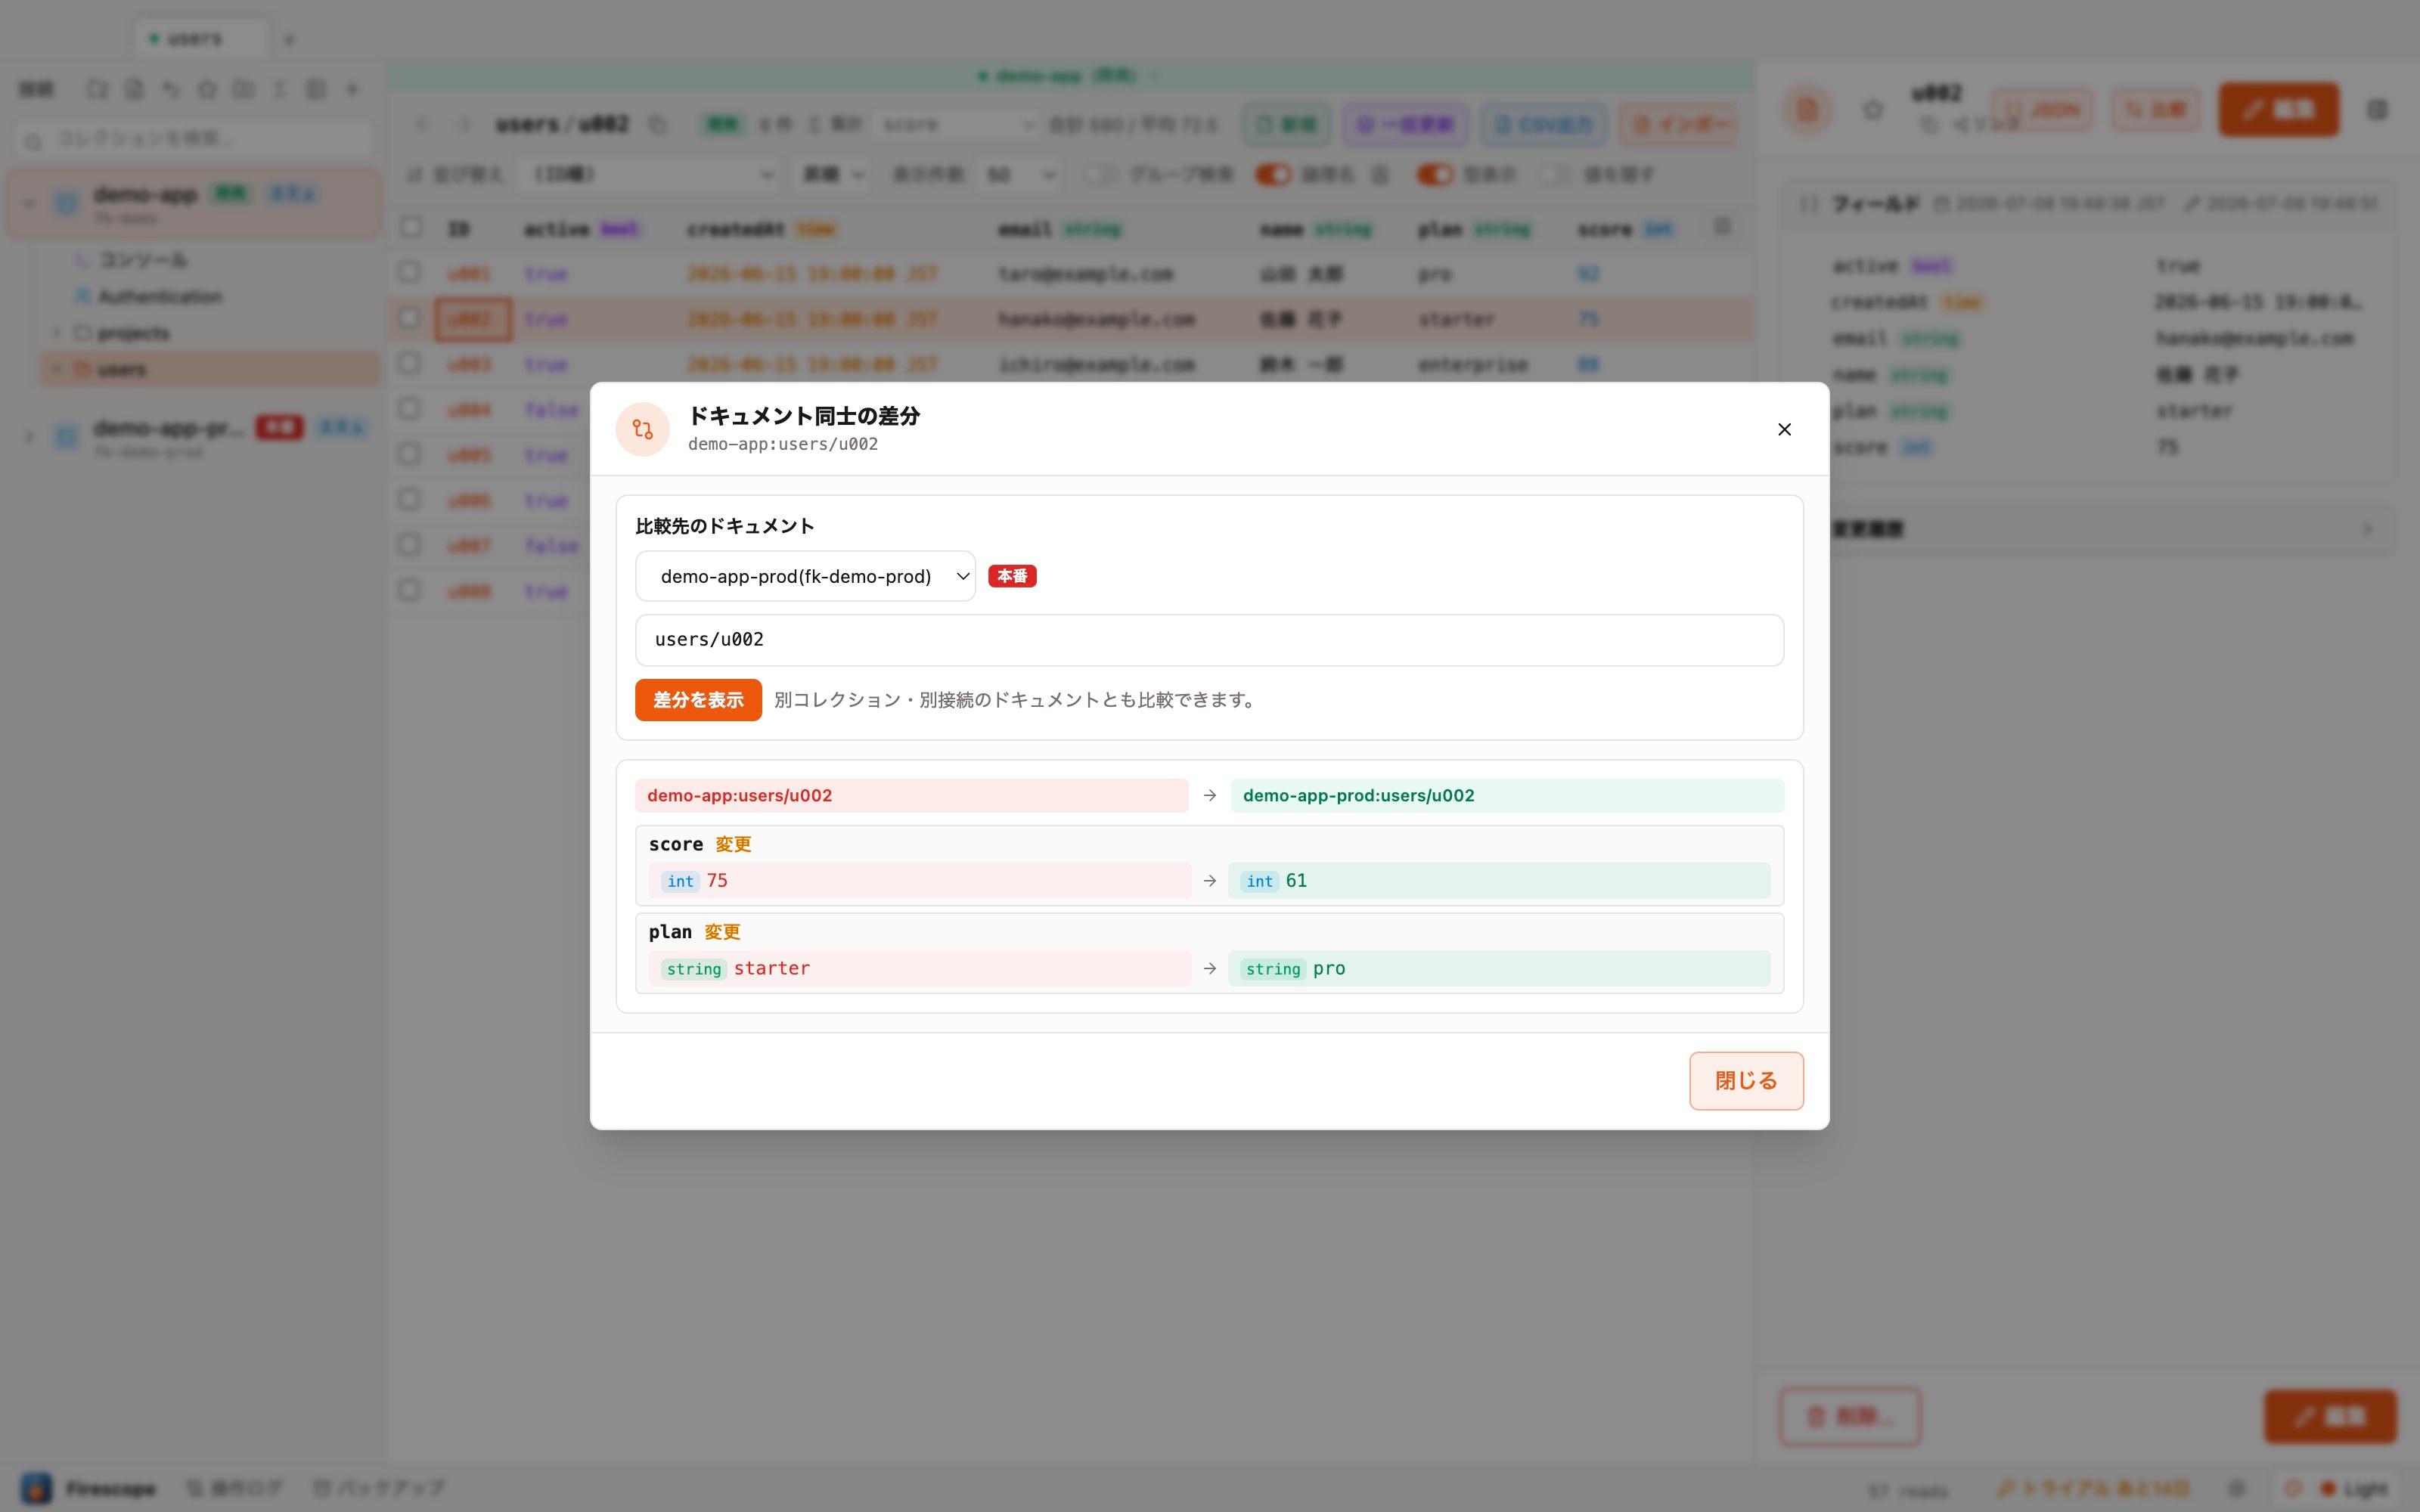
The "Compare" button in the document's right-hand panel lets you compare the open document field-by-field with any other document (in a different collection or even a different connection).
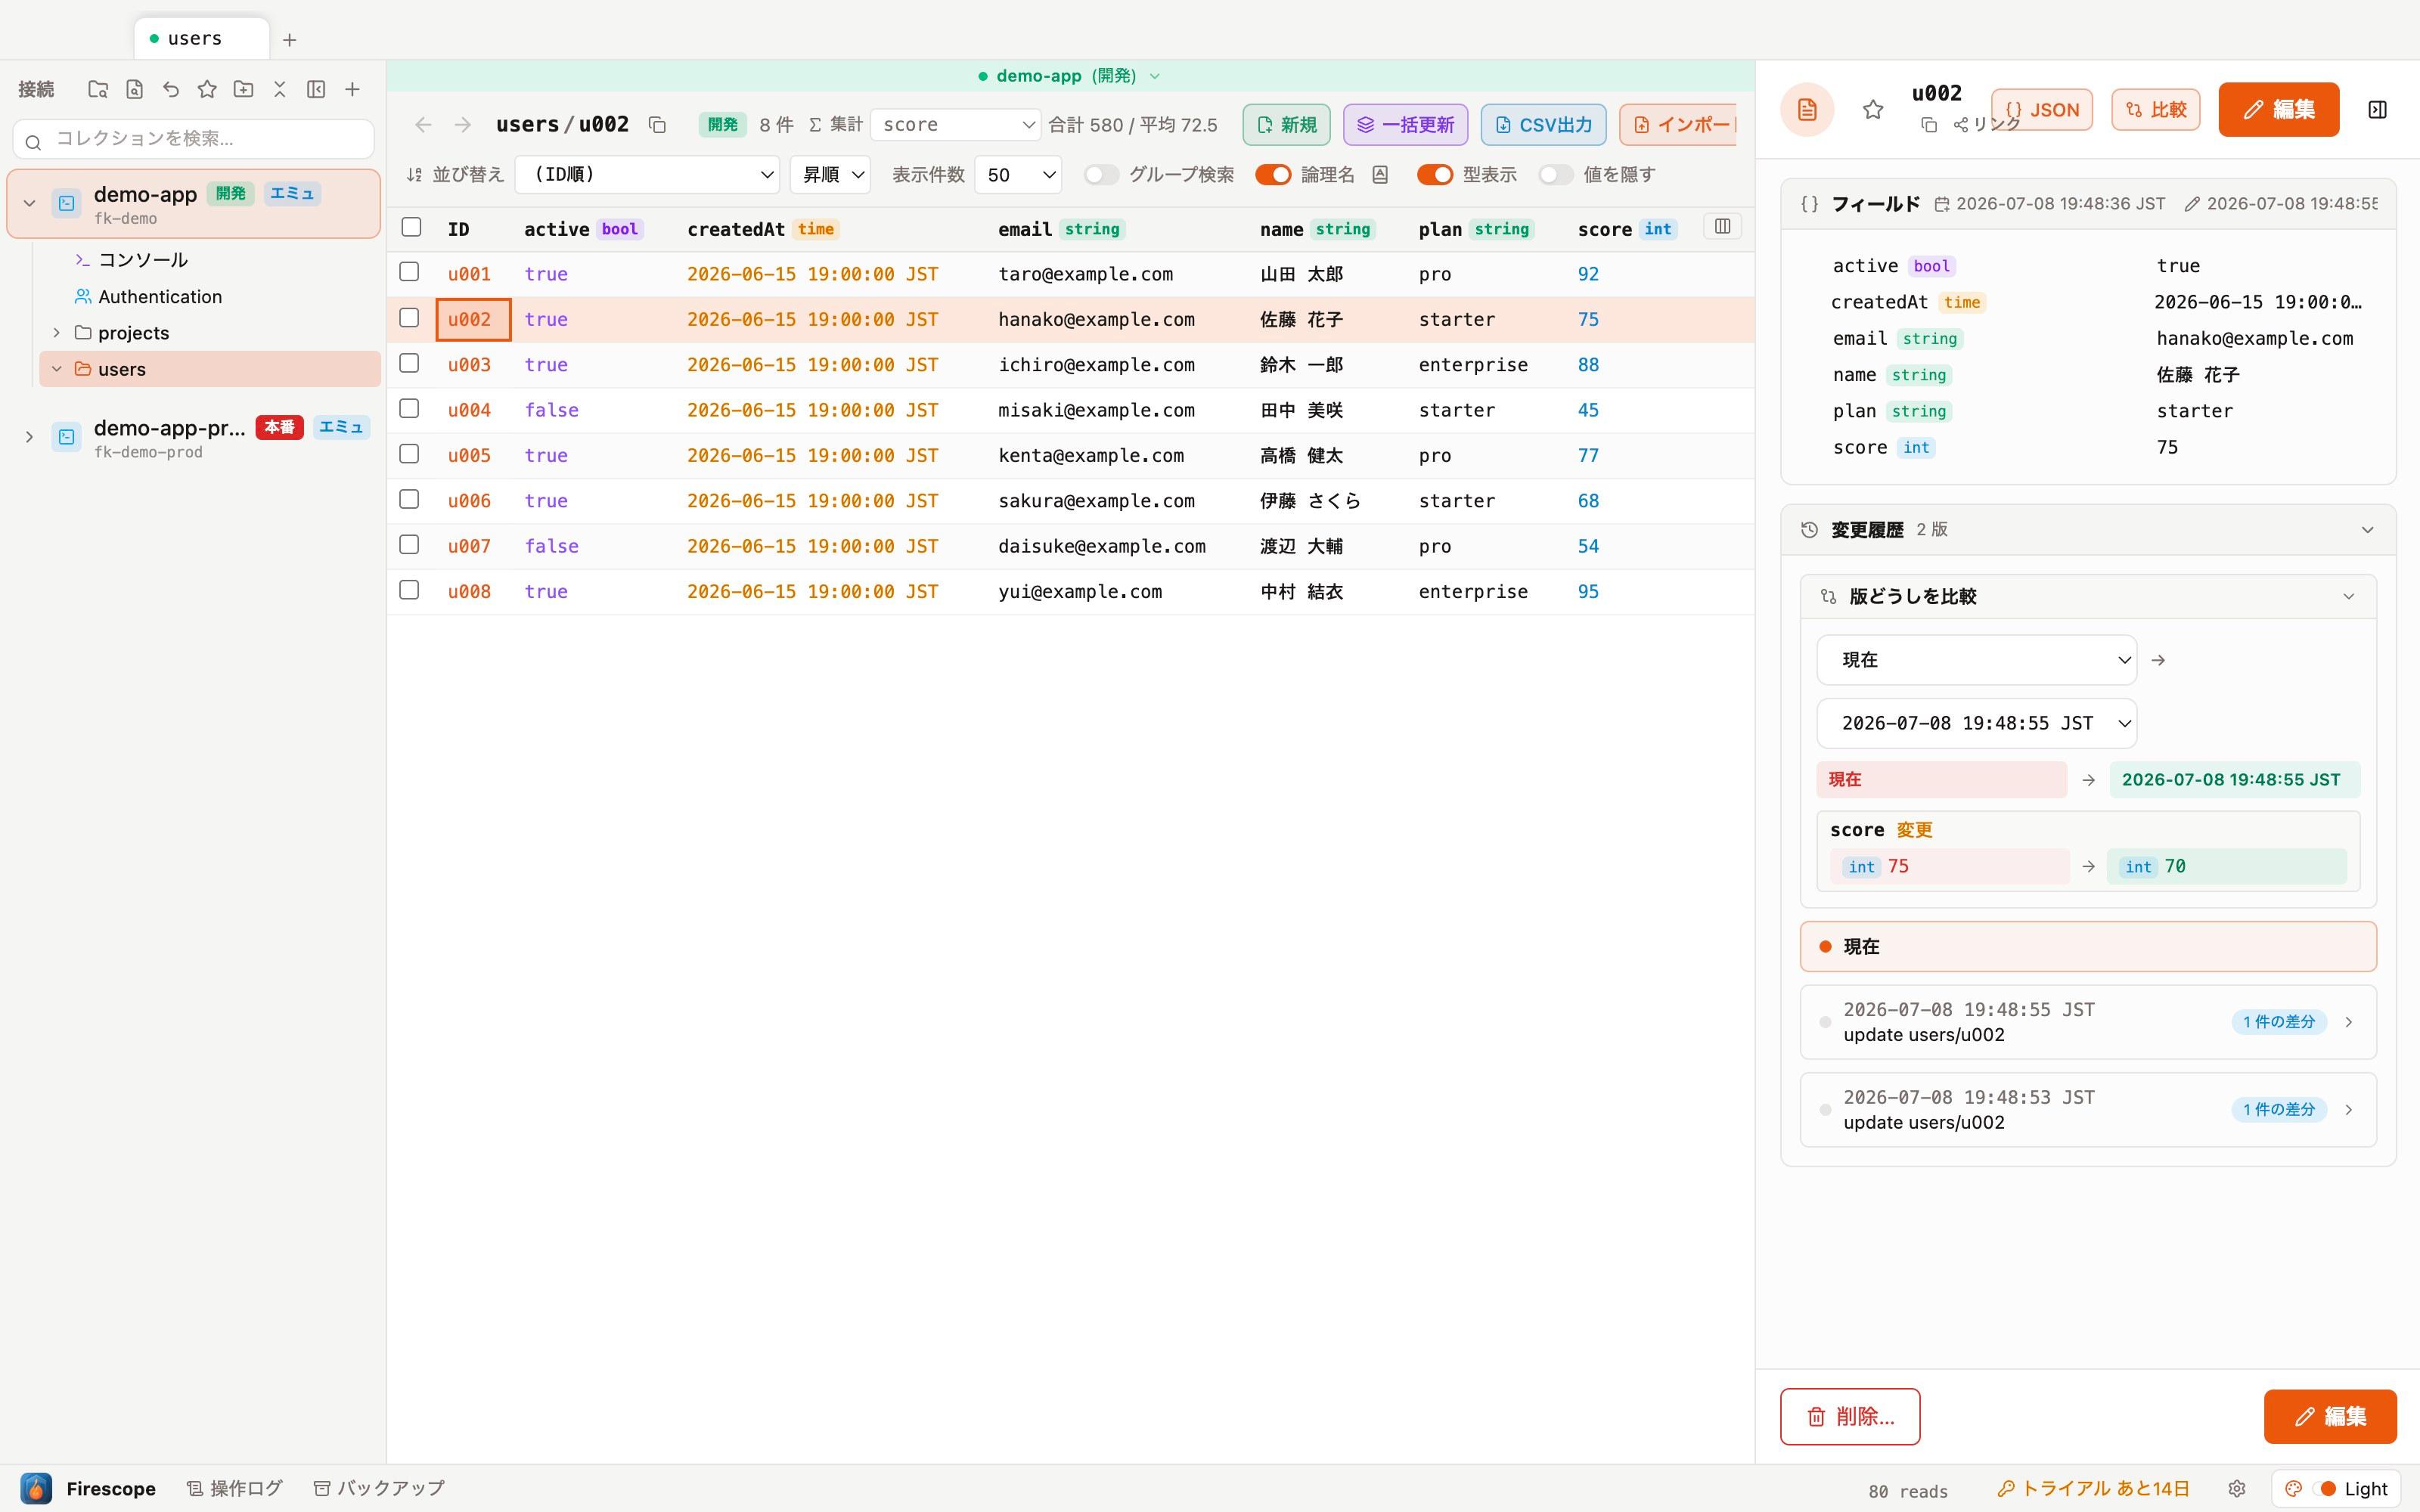
A document's "Change history" lists its automatic backups as a chronological set of versions, and you can pick any two versions (including the current one) to compare the diff.
Authentication users
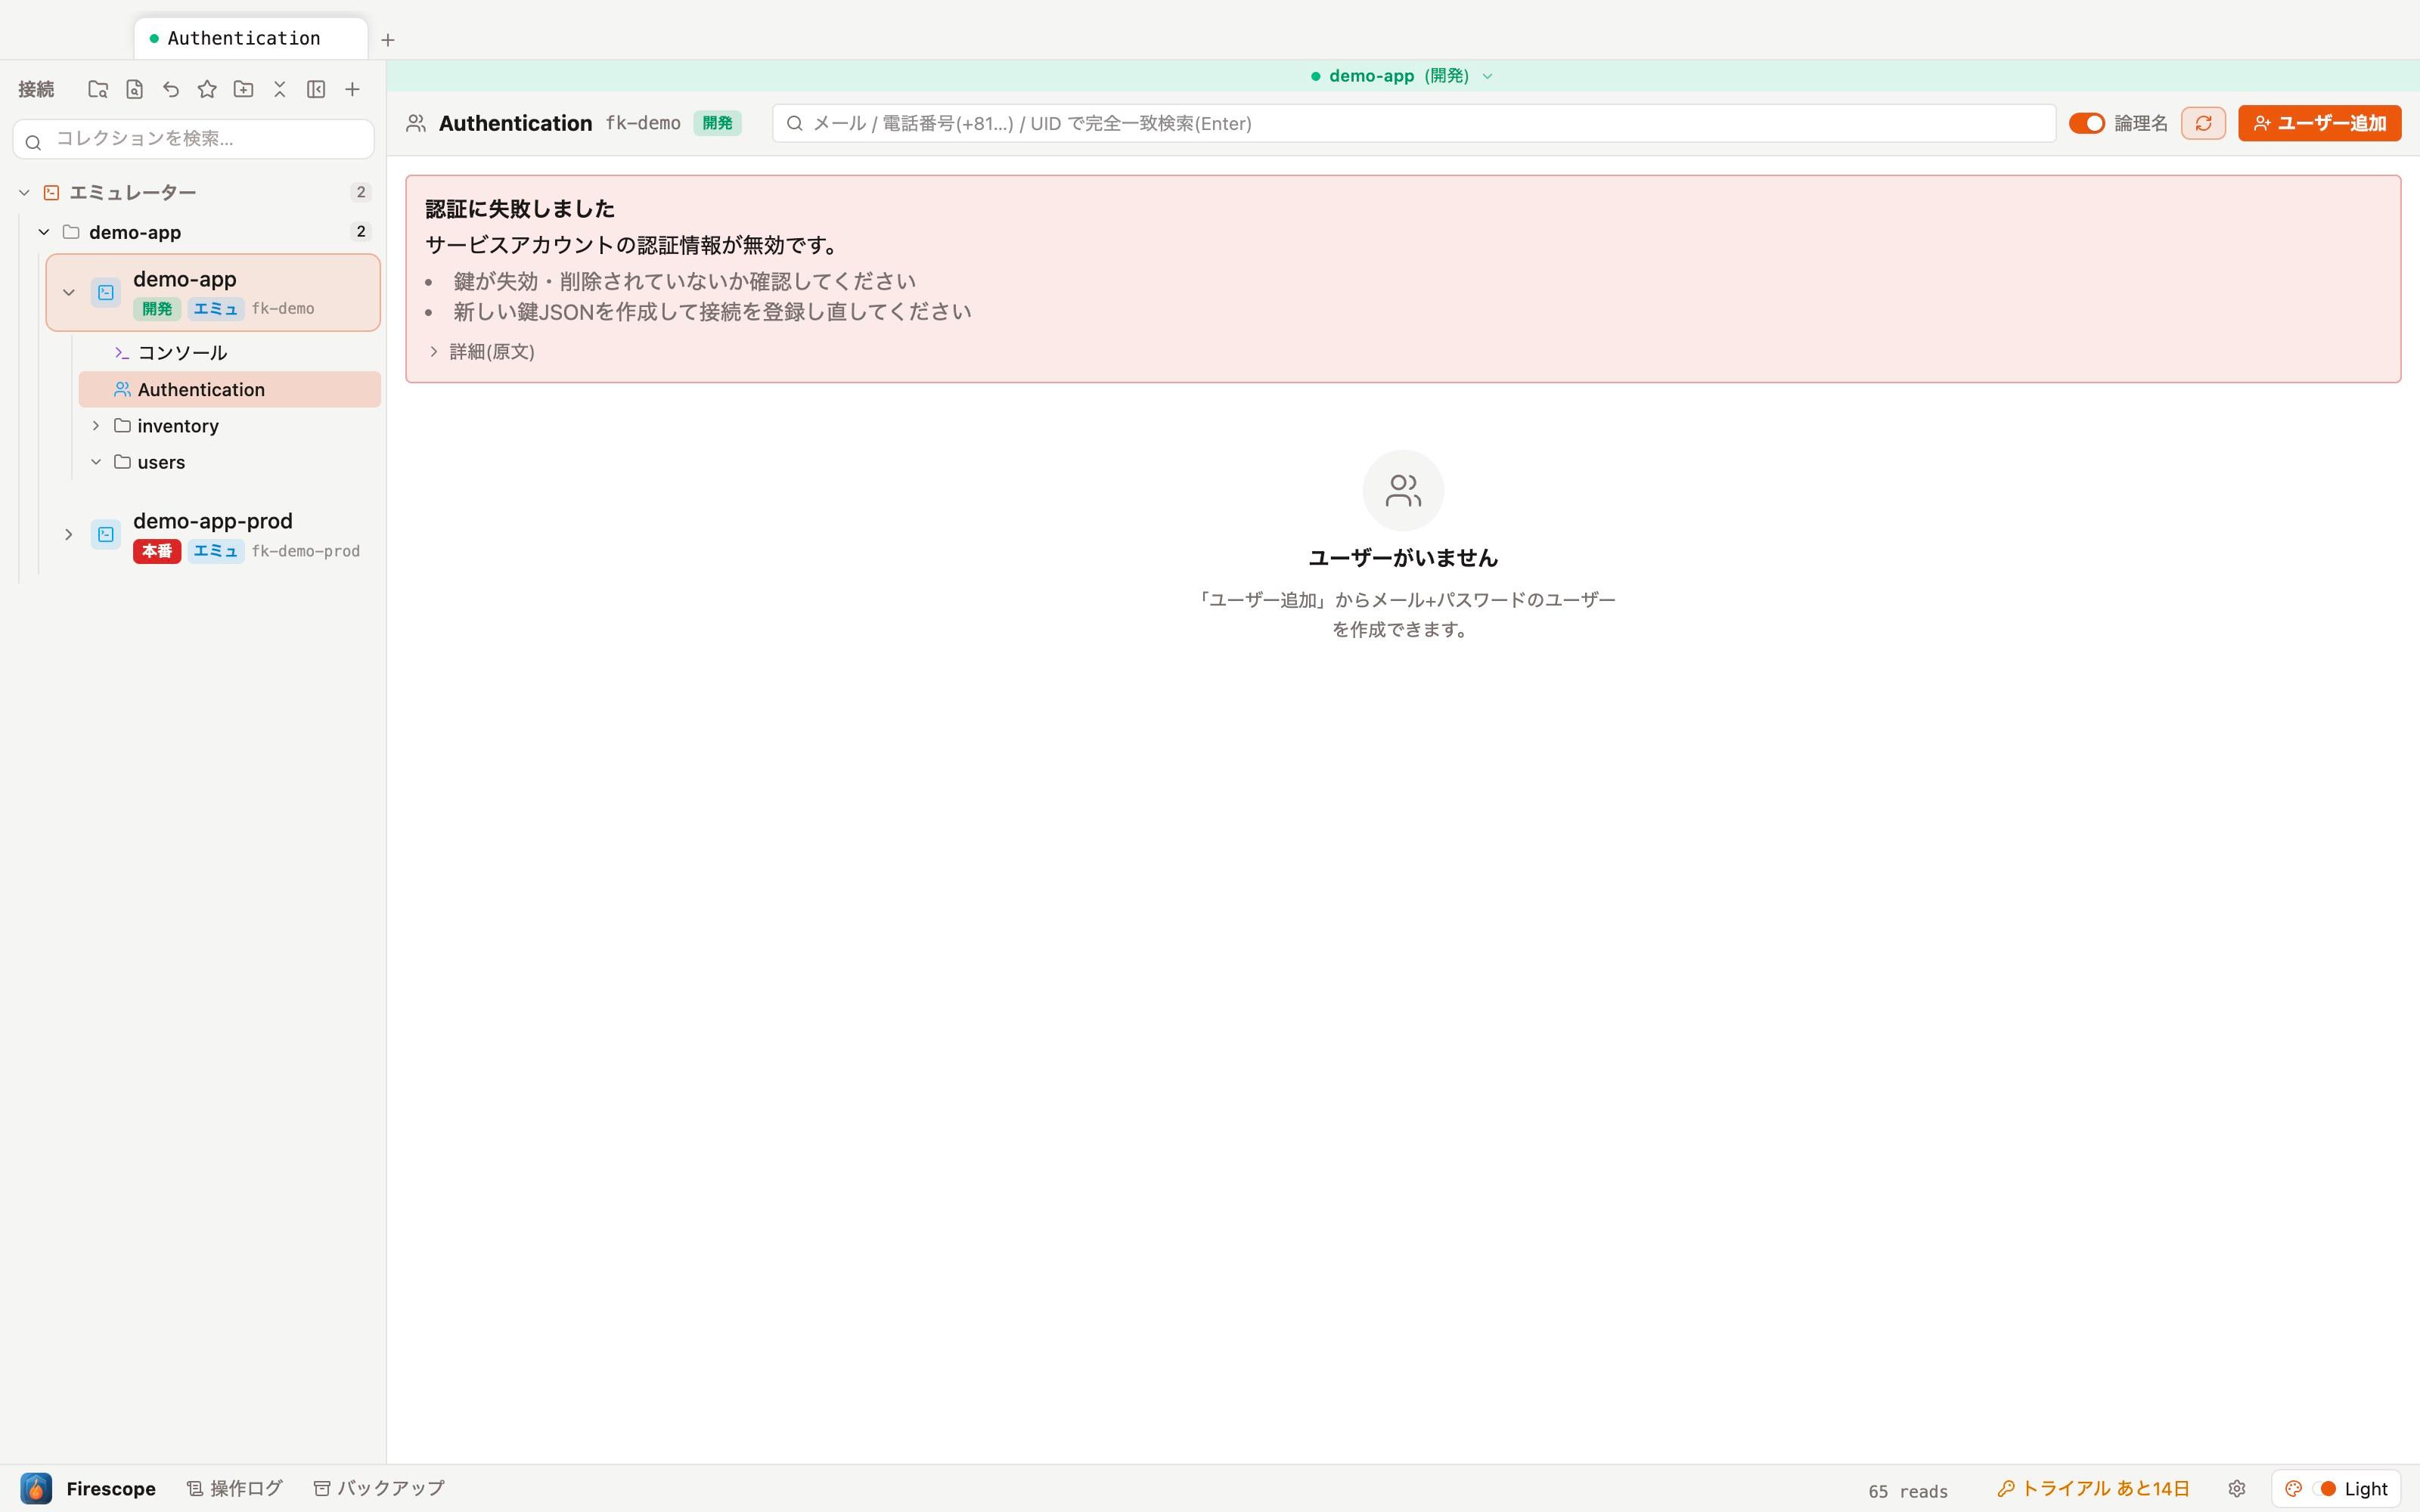
"Authentication" in the sidebar lists and manages Firebase Authentication users.
- Lists email, display name, provider, creation date, and last sign-in. The logical names toggle can show Japanese labels for these fields too.
- Supports disabling / enabling / deleting users and sending password reset emails.
- Copy a user's UID to cross-reference it with documents on the Firestore side.
- Destructive operations (such as deletion) go through the same safety pipeline as Firestore (confirmation → operation log).
Shared log (who / when / what)
Records write-operation metadata to your project Firestore so that everyone connecting to the same project can see who did what, and when.
- Enable it per connection: right-click the connection in the sidebar → "Record shared log". The confirmation dialog explains everything and lets you set your operator name in one step.
- Only metadata is recorded (operator name, operation kind, target path, result, duration). Document values are never included, and nothing is sent to external servers — events live in the _firescope_audit collection of that project.
- View it in Operation Log → "Shared log" tab: a date-grouped timeline with operator/kind/period filters. Click a row for details and open the target document right in the grid.
- Logs are automatically deleted after 30 days.
Find and share
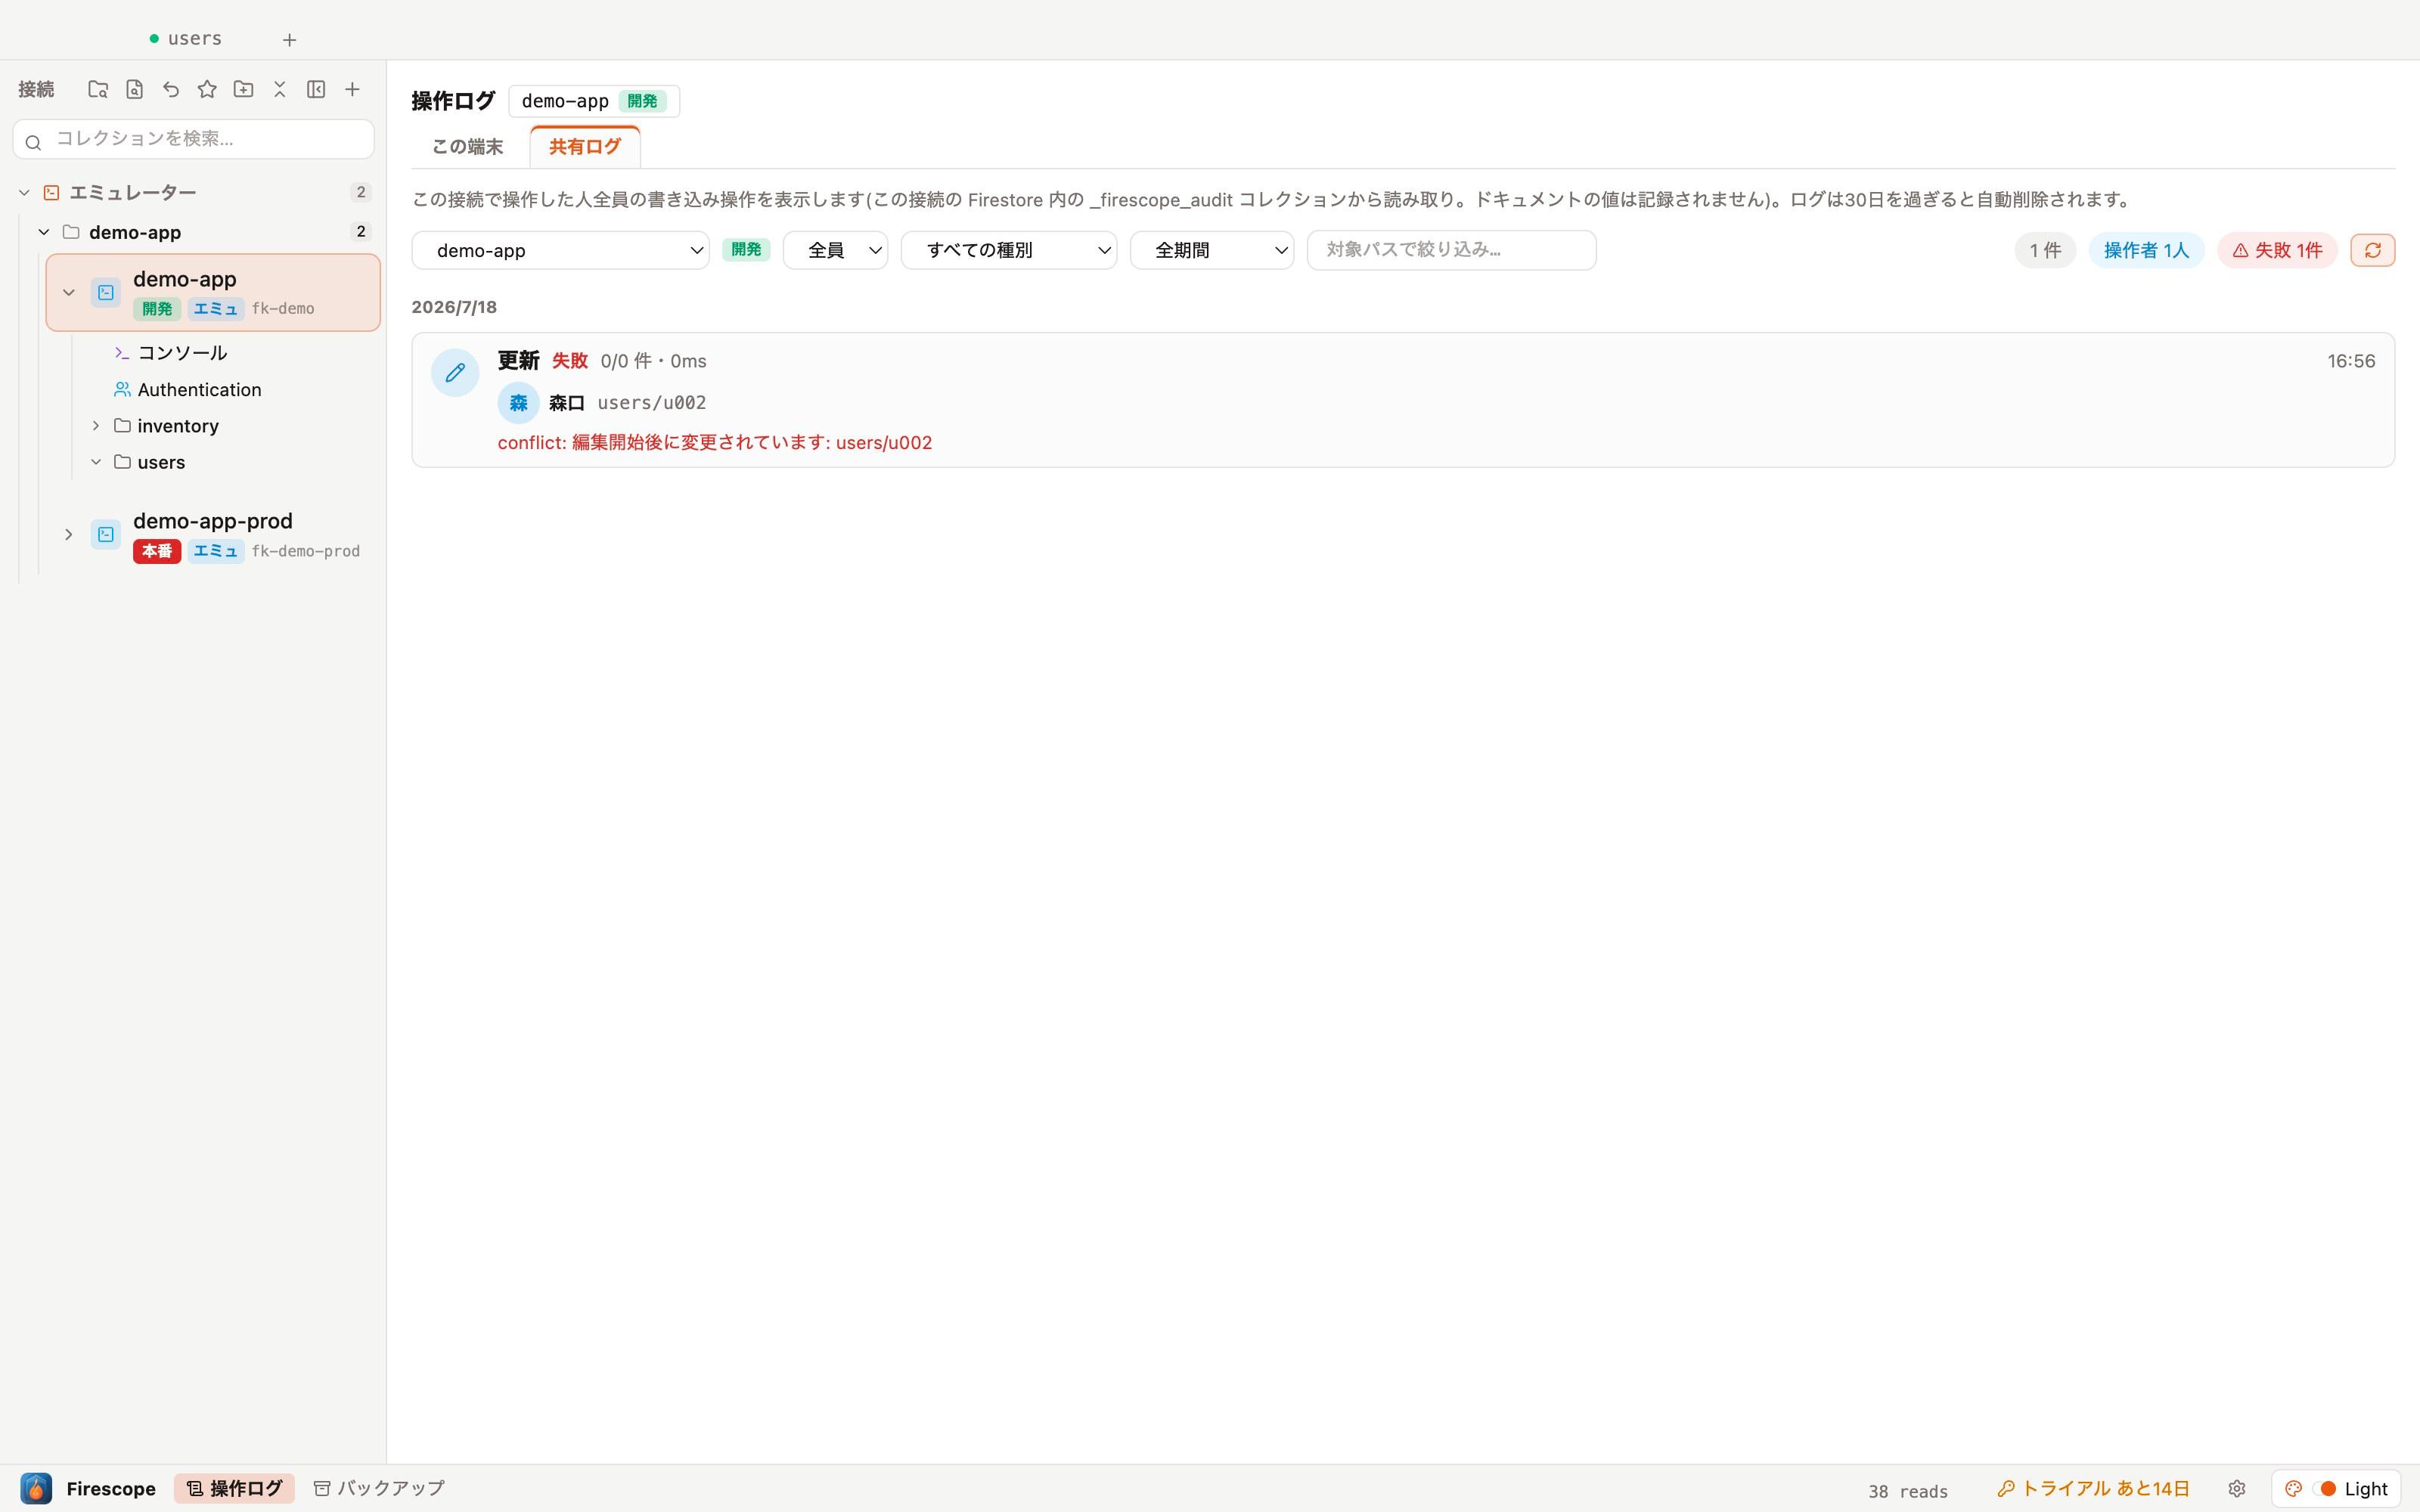
"Value search" looks for a value across every document and every field in a collection, even when you don't know which field it lives in. It shows an estimated read count before running, so it's safe to use even on large collections.
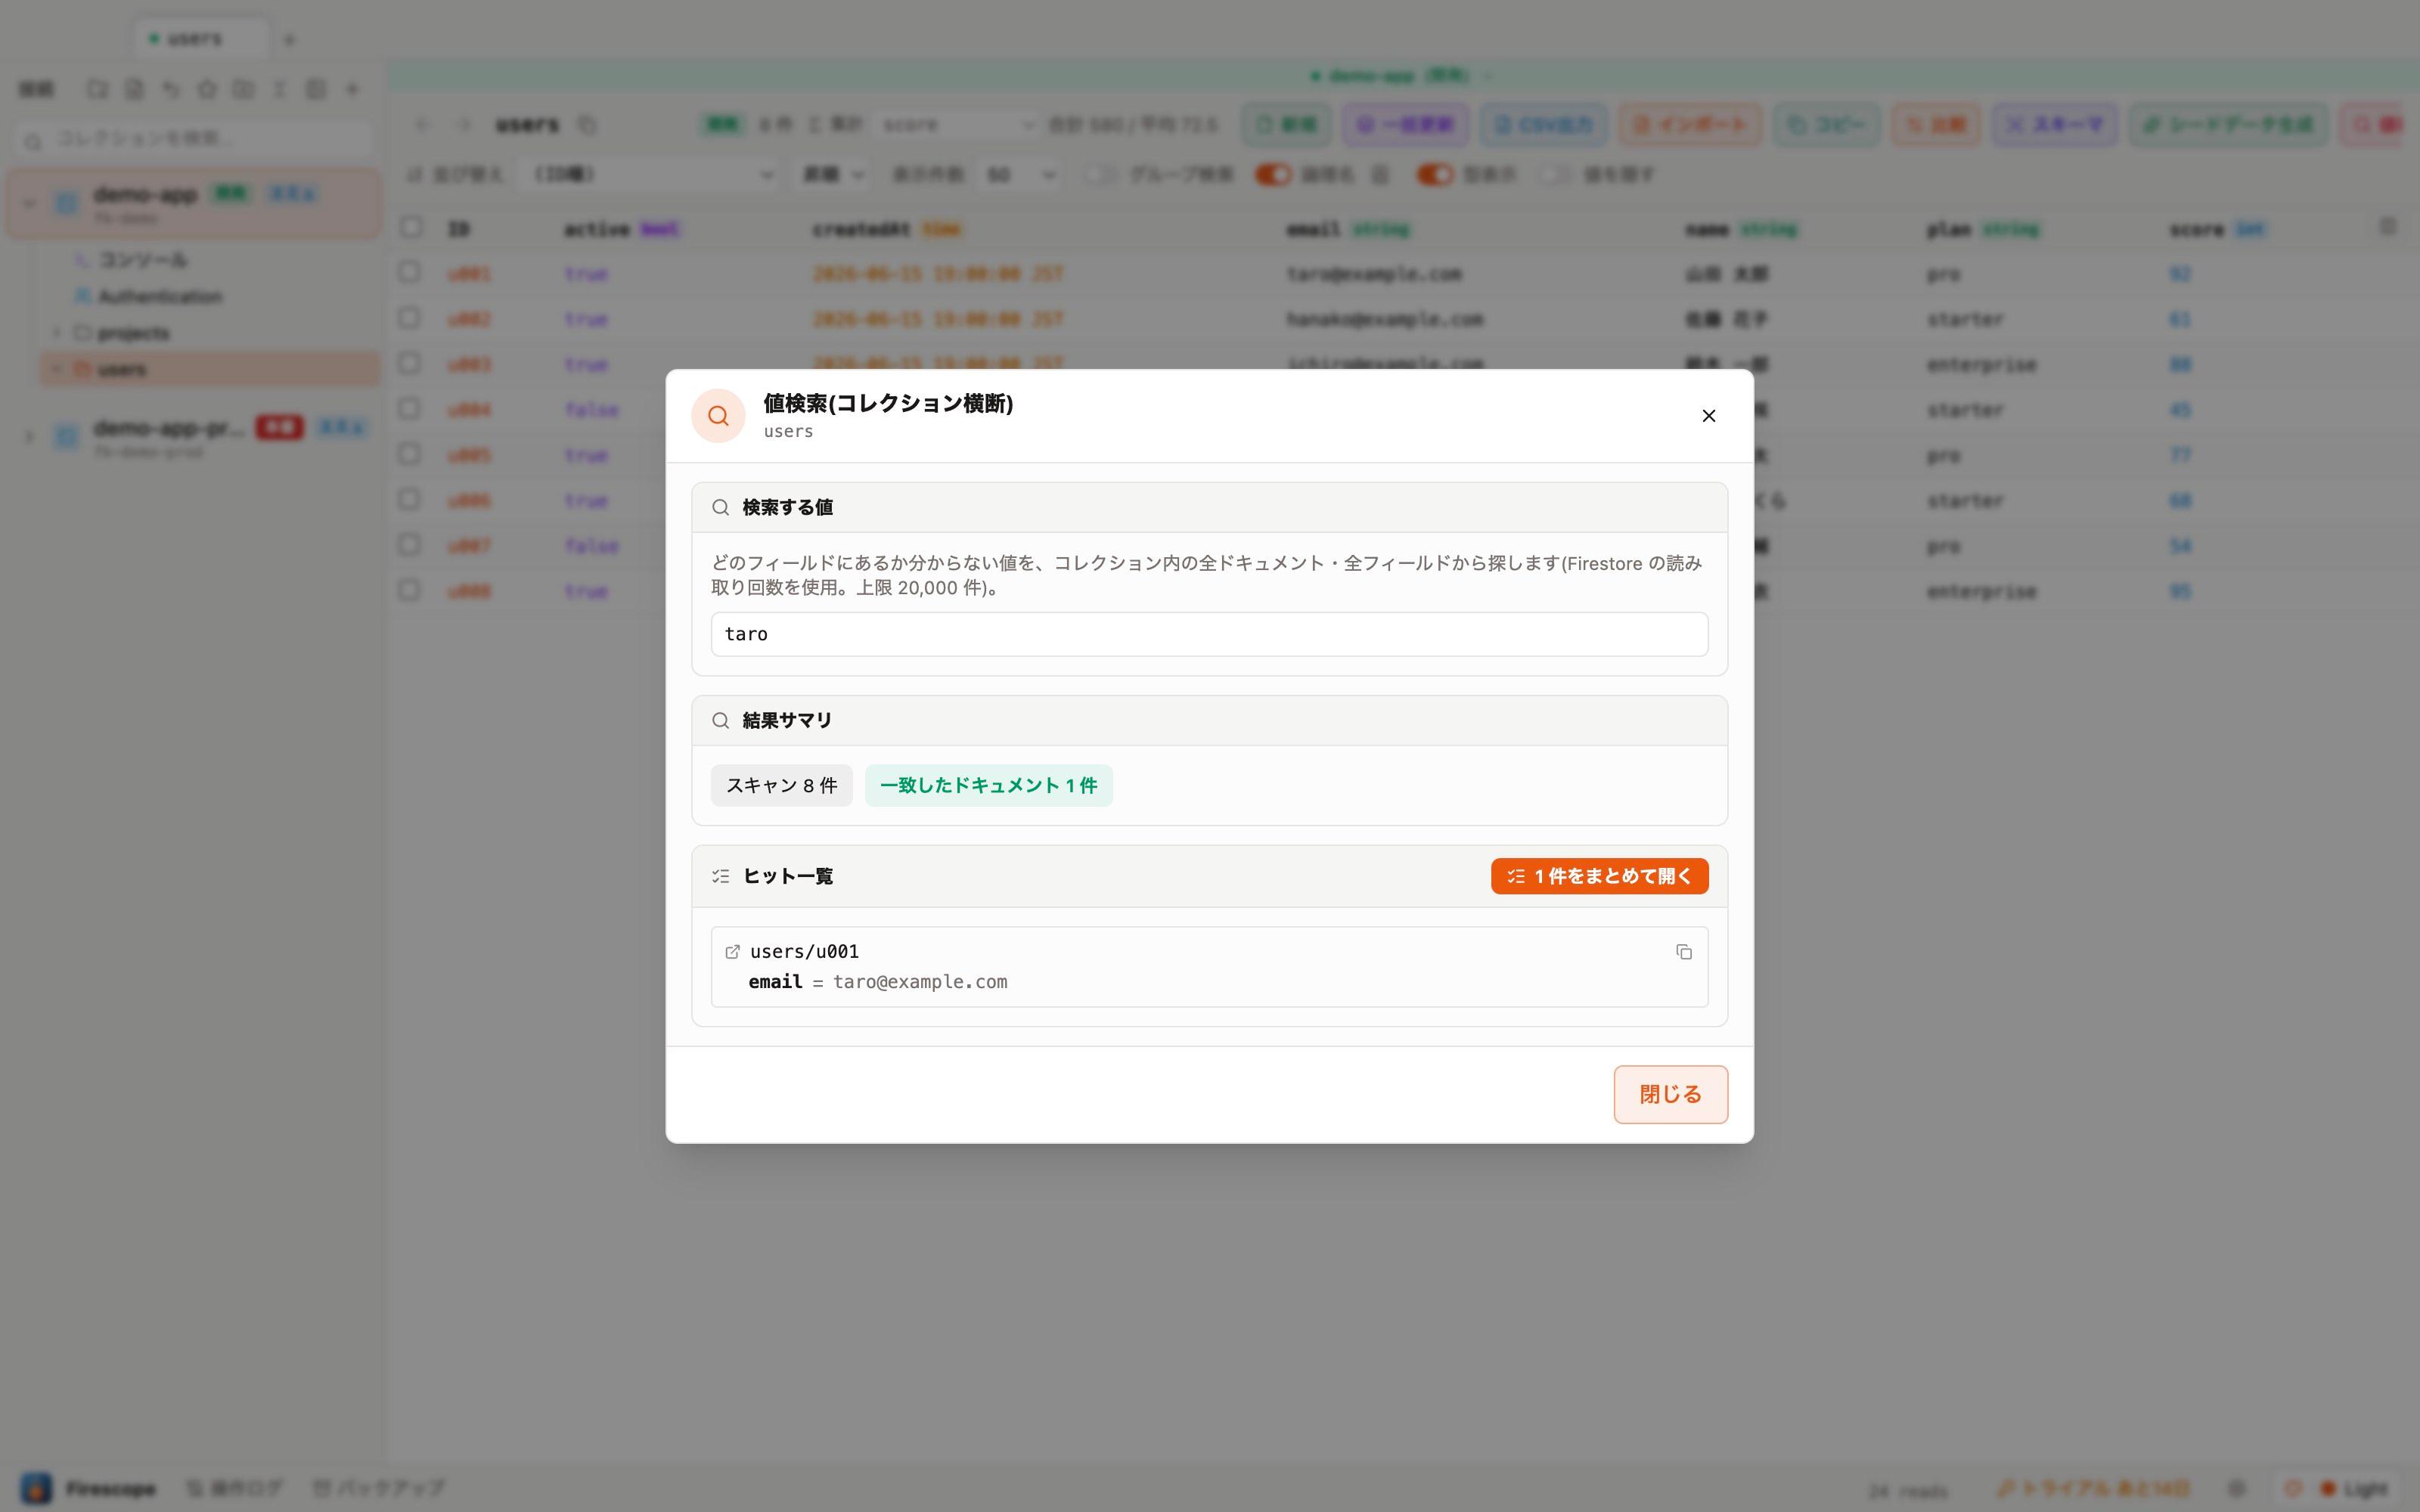
★ Bookmark a document and you can recall it anytime from the ★ icon in the sidebar, across connections. The "Recently viewed" tab automatically keeps a history of documents you've opened.
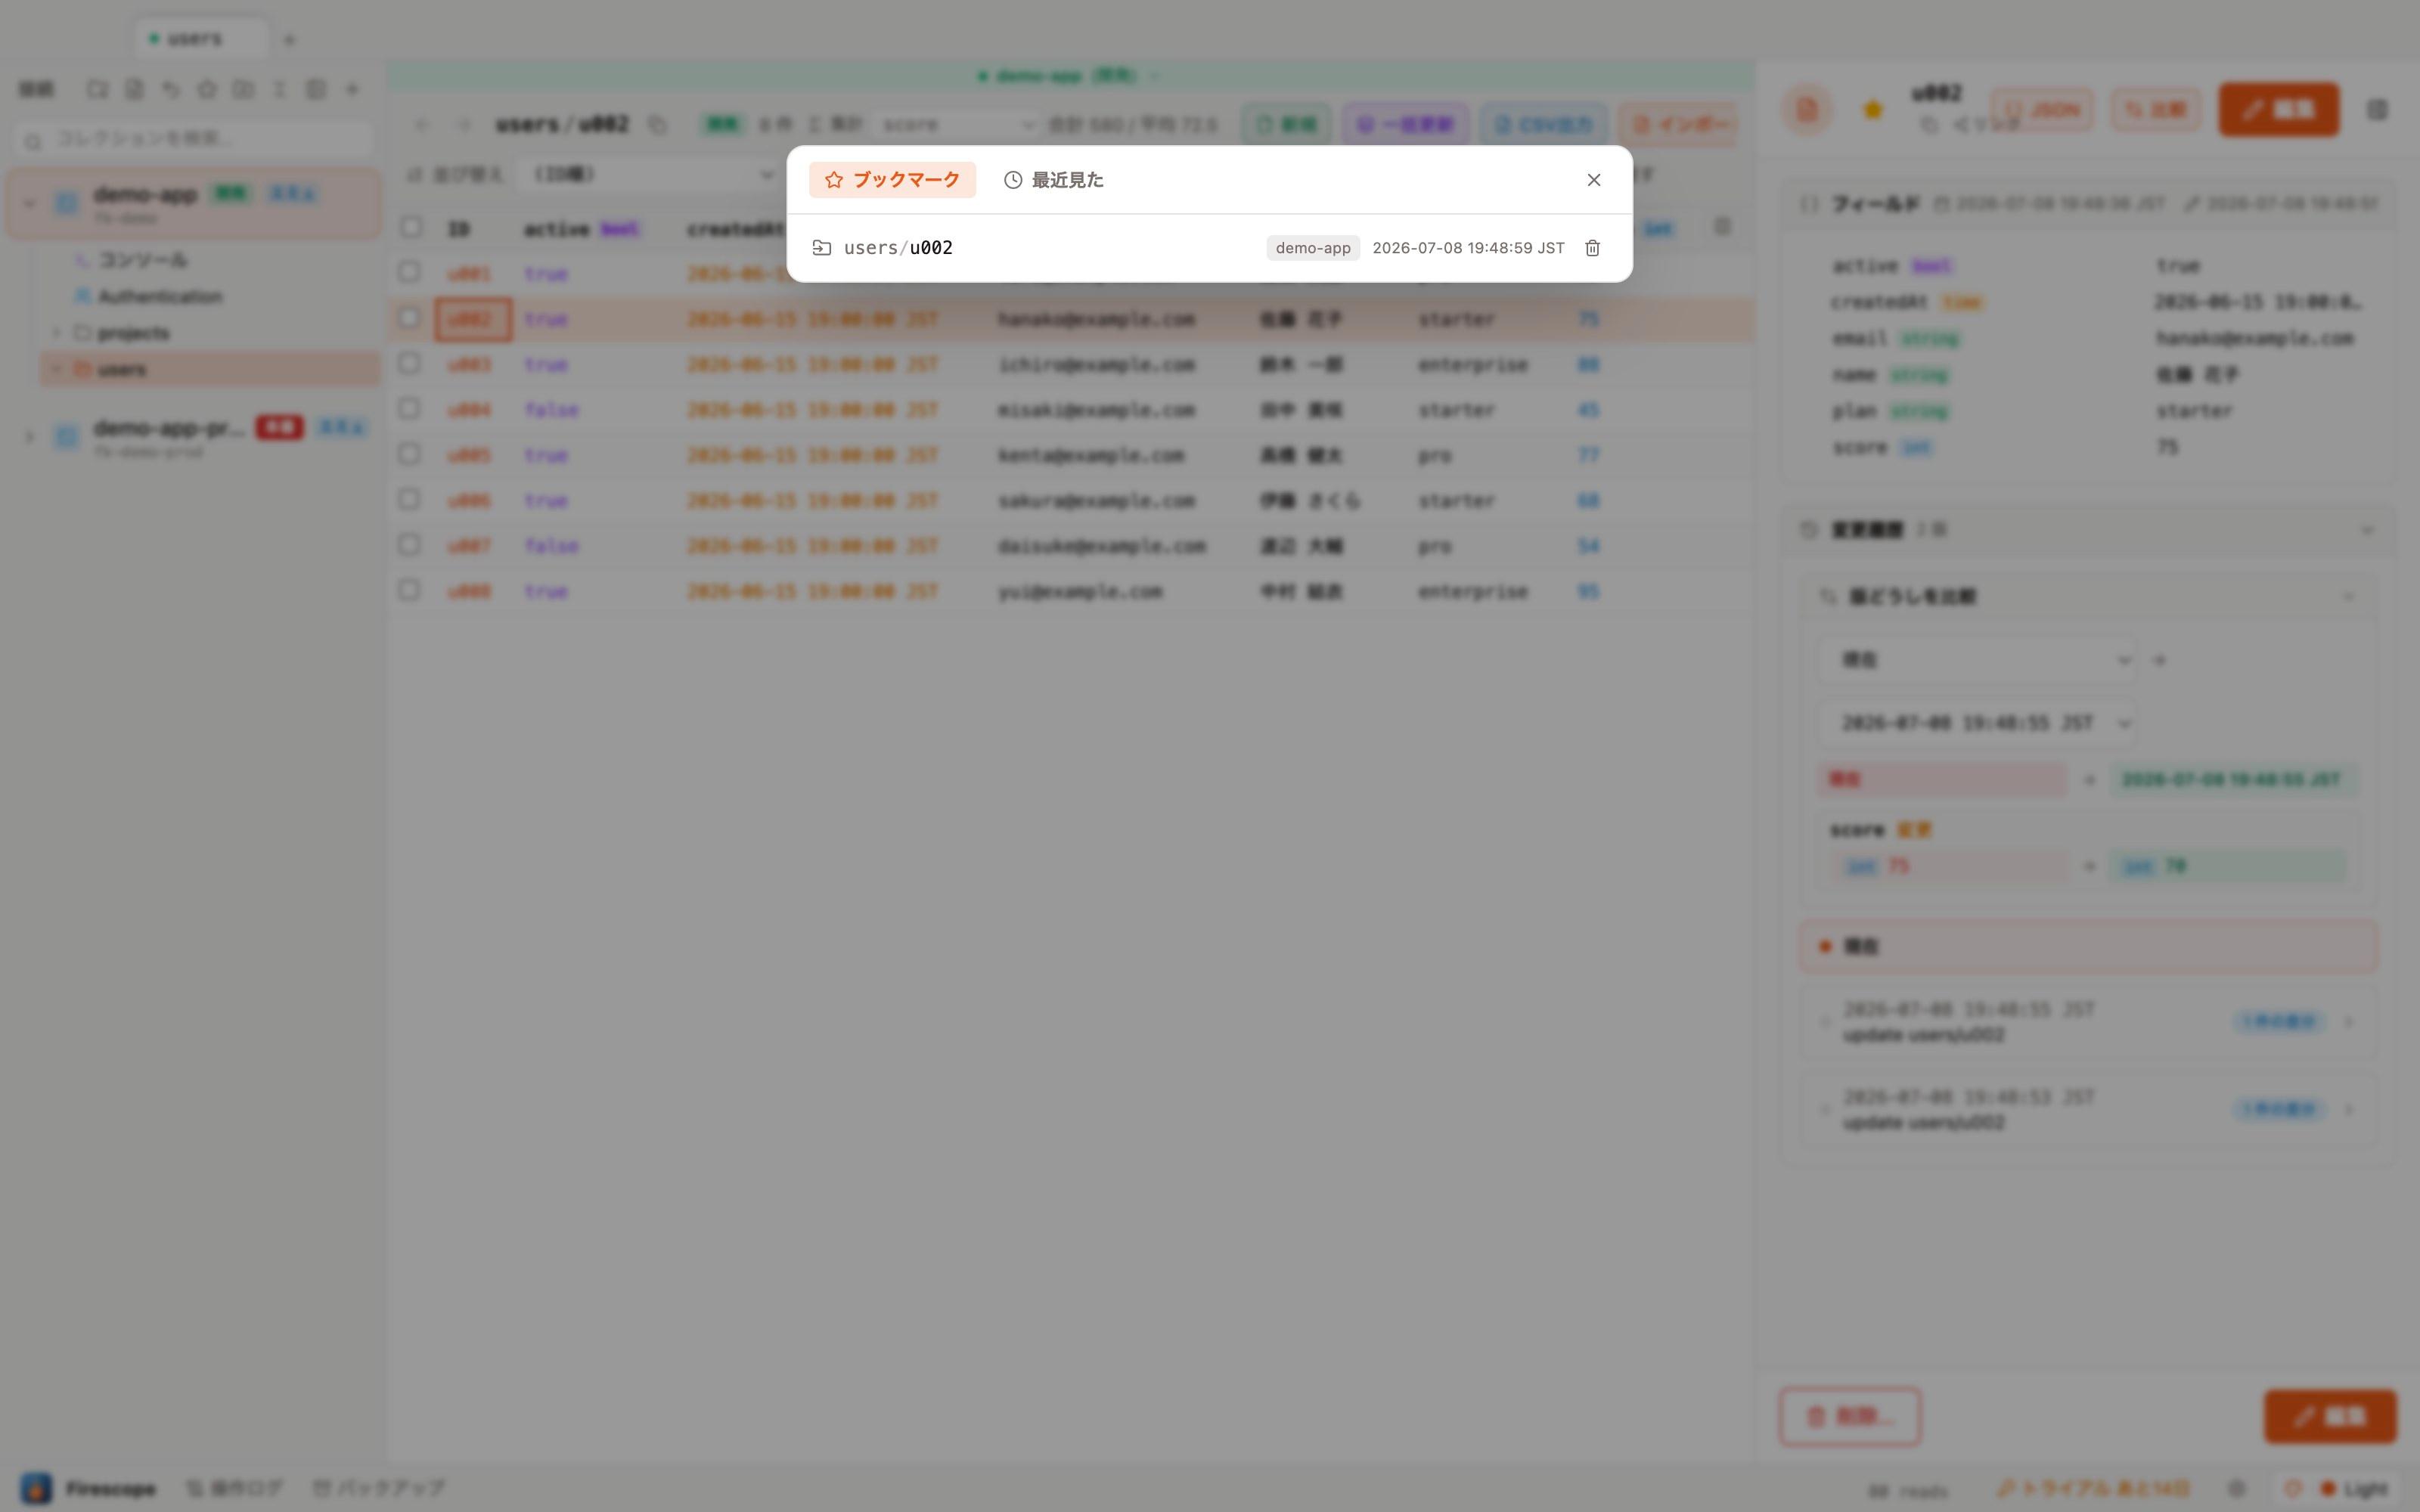
- The "Link" option in the document's right-hand panel copies a deep link (
firescope://) — share it via Slack or similar and the recipient's Firescope opens that exact document directly. - The external-link icon in the breadcrumb jumps straight to the matching path in the Firebase console (web) (hidden for emulator connections).
Operations
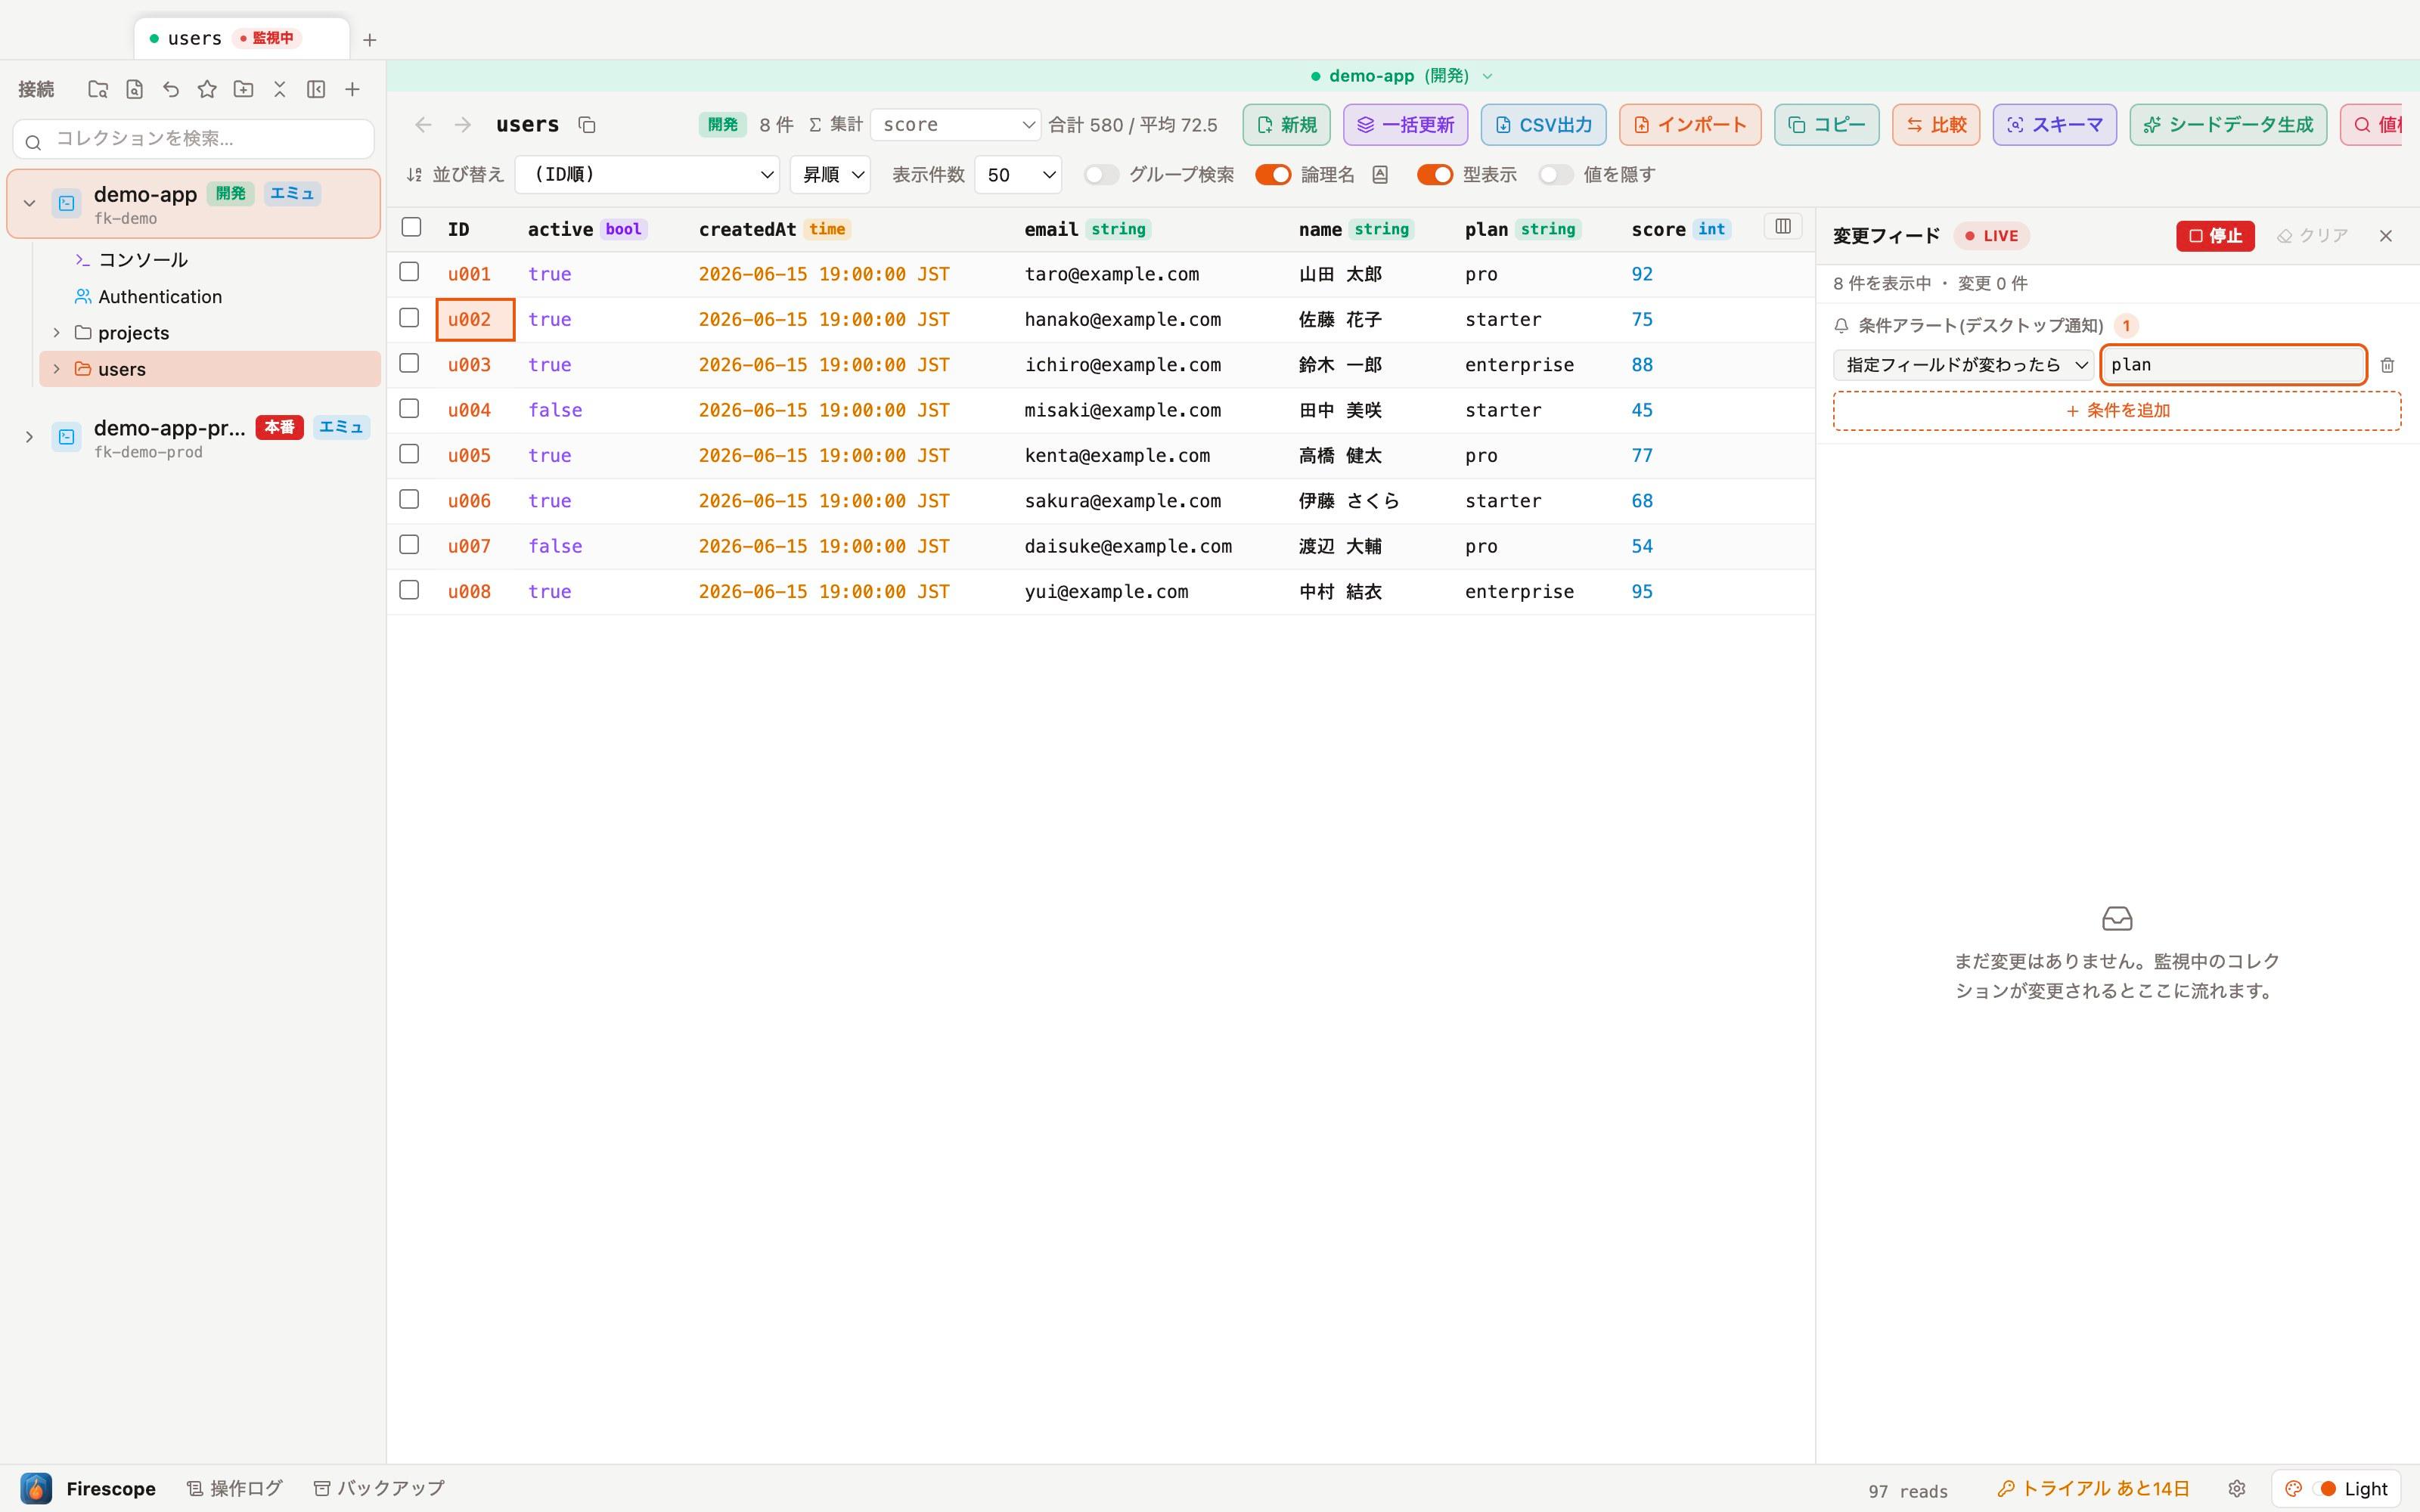
Real-time watch supports conditional alerts. Register "on add", "on delete", or "when a given field changes" and a desktop notification arrives whenever a matching change occurs.
Click the read count in the footer to see, in a popover, the estimated read count for the session, the estimated cost, and the trend over time.
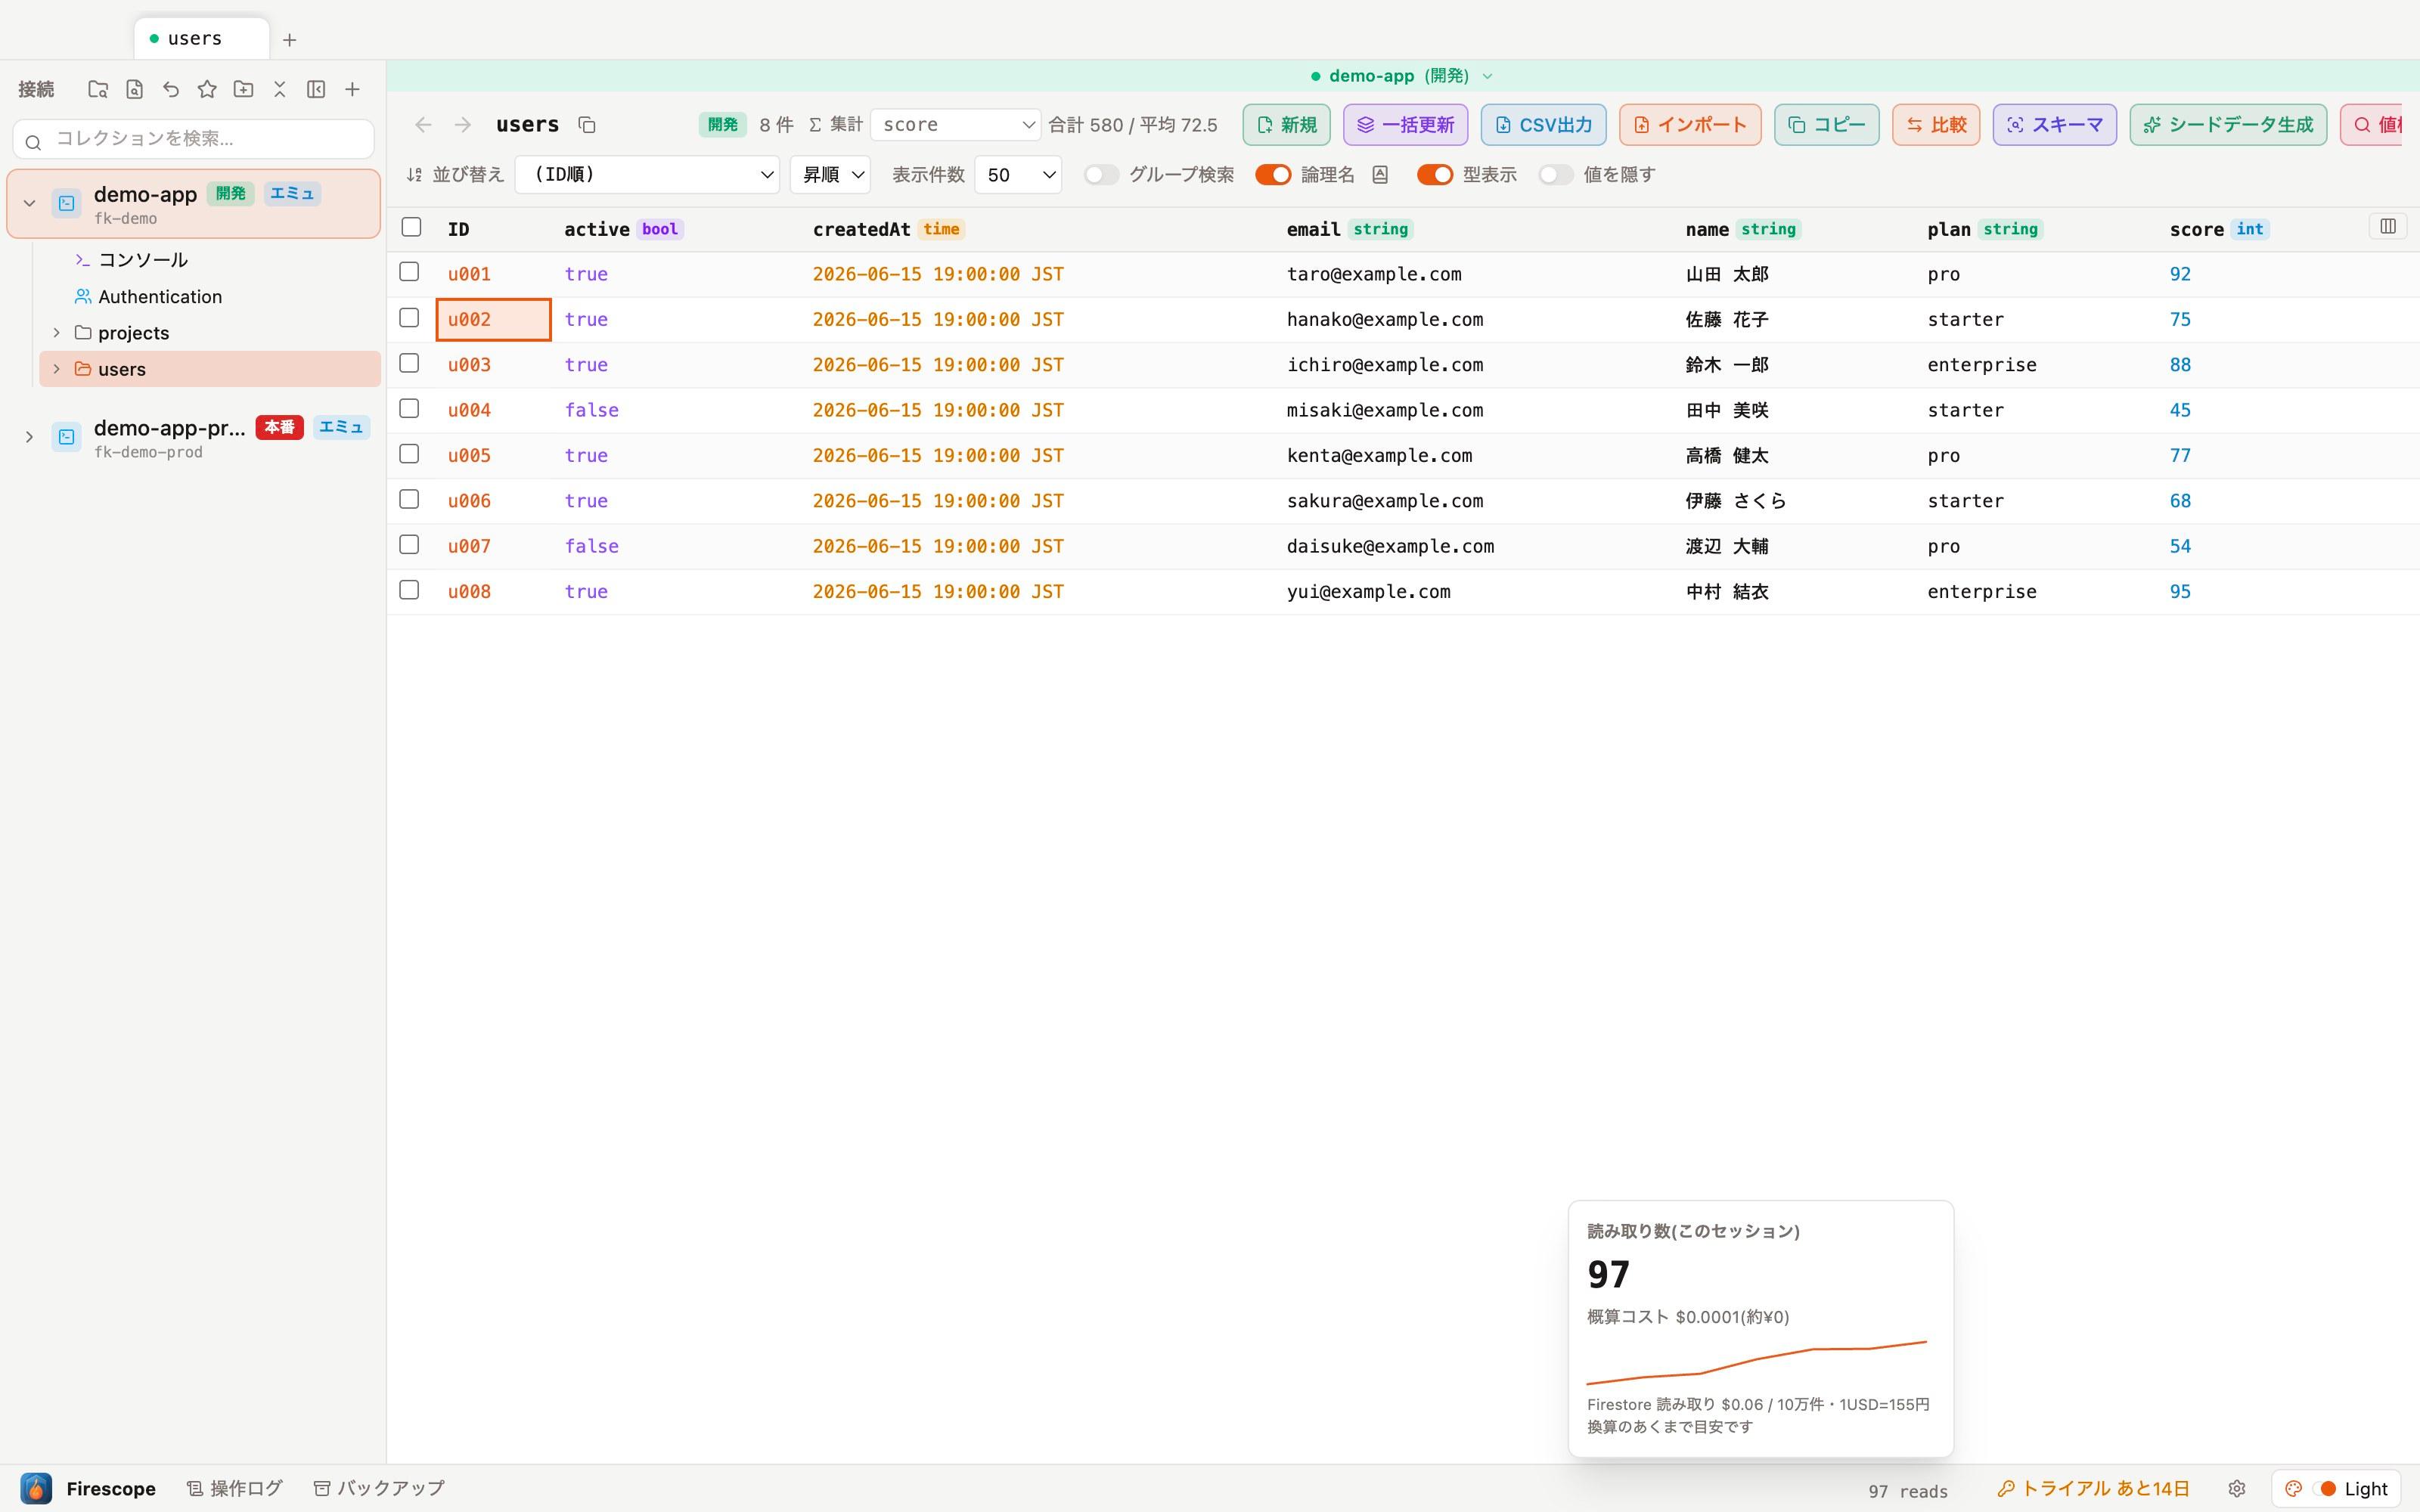
The "Share & transfer" tab in settings can export/import some UI settings — field logical names, saved queries, bookmarks — as a single JSON file. It never includes connection private keys, license information, or environment labels, so it's safe to share within a team or when switching machines.
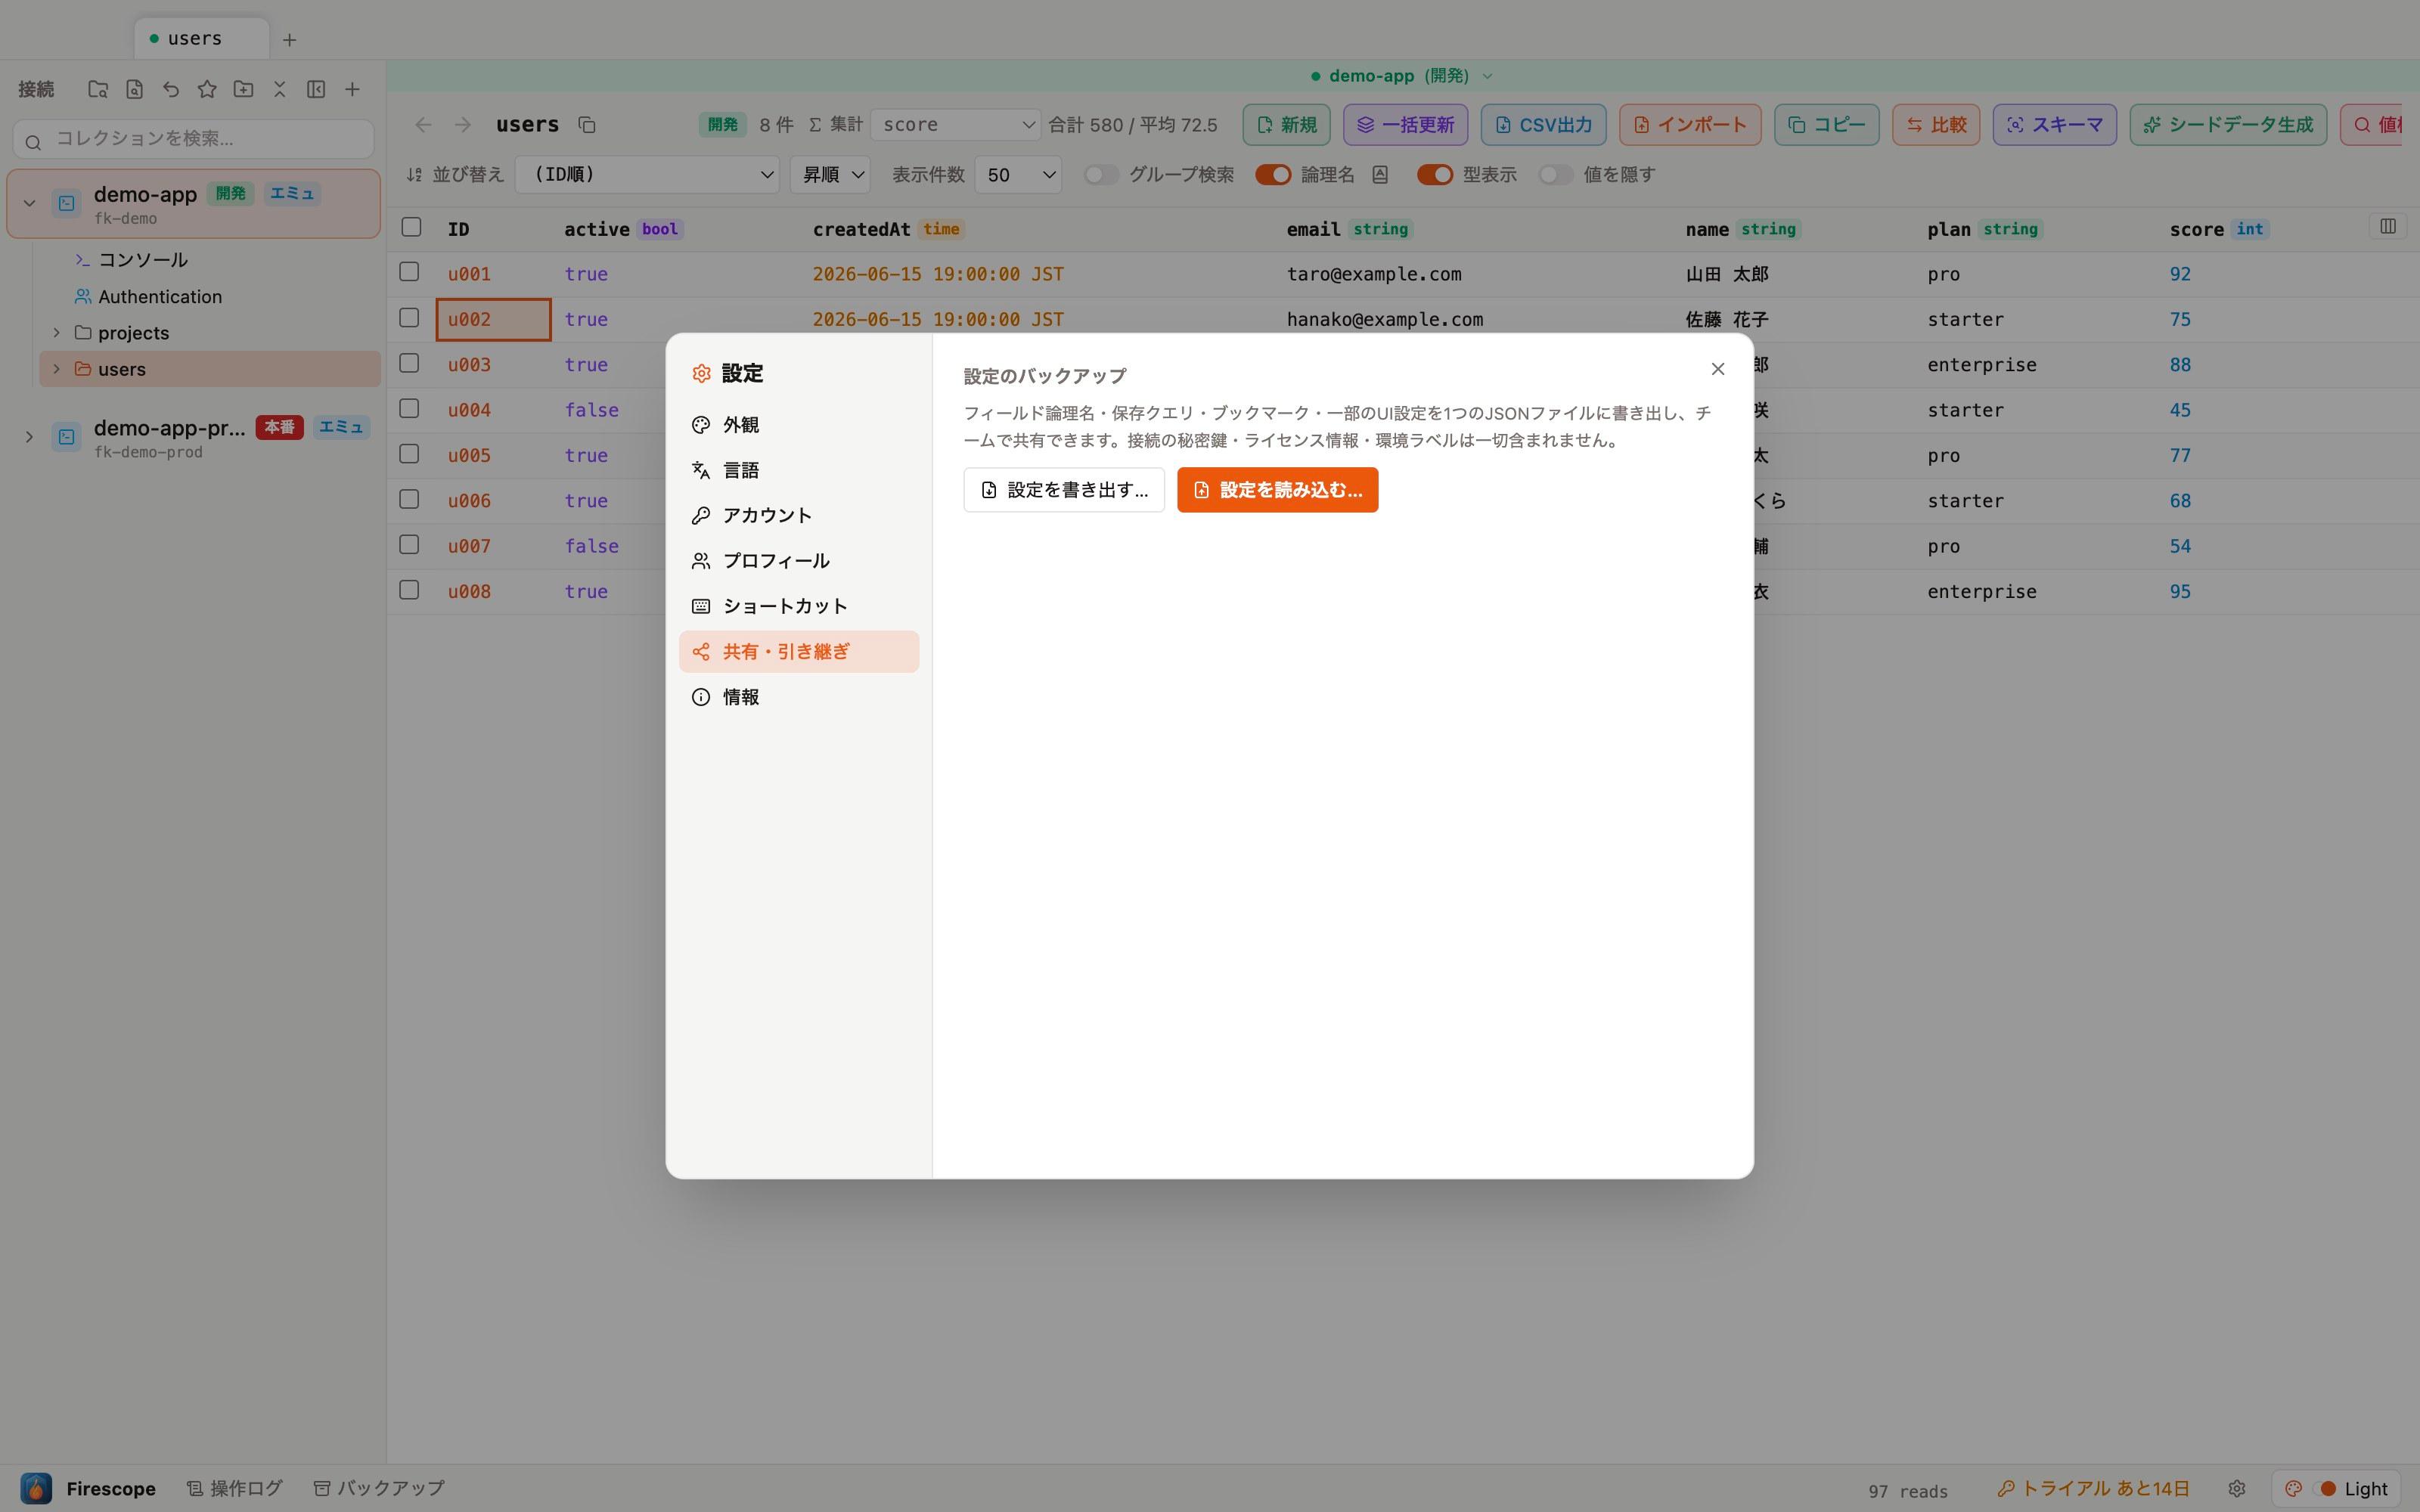
Turning on "Mask values" in the toolbar keeps field names, types, and structure visible while hiding the actual data behind bullets (••••). Handy for screen sharing or screenshots (display-only — the underlying data is never changed).
MCP server (AI agent integration)
Firescope ships with an MCP (Model Context Protocol) server. Connect from an AI agent such as Claude Code and you can list Firestore collections, fetch documents, and run queries right from the conversation.
Start it (from the repository root):
# Connecting to the emulator
FIRESCOPE_MCP_PROJECT_ID=your-project \
FIRESCOPE_MCP_EMULATOR_HOST=127.0.0.1:8080 \
npm run mcp

# Connecting to a real project via a service account JSON
FIRESCOPE_MCP_SERVICE_ACCOUNT_PATH=/path/to/service-account.json \
npm run mcp
Example MCP client configuration (.mcp.json):
{
  "mcpServers": {
    "firescope": {
      "command": "npm",
      "args": ["run", "mcp"],
      "cwd": "/path/to/firescope",
      "env": {
        "FIRESCOPE_MCP_SERVICE_ACCOUNT_PATH": "/path/to/service-account.json"
      }
    }
  }
}- Three tools are provided: list collections (
firestore_list_collections), get a document (firestore_get_document), and run a query (firestore_query_collection, supporting filters/sort/limit). - It reuses the same internal logic as the GUI query builder, so results match what the app displays.
Updates
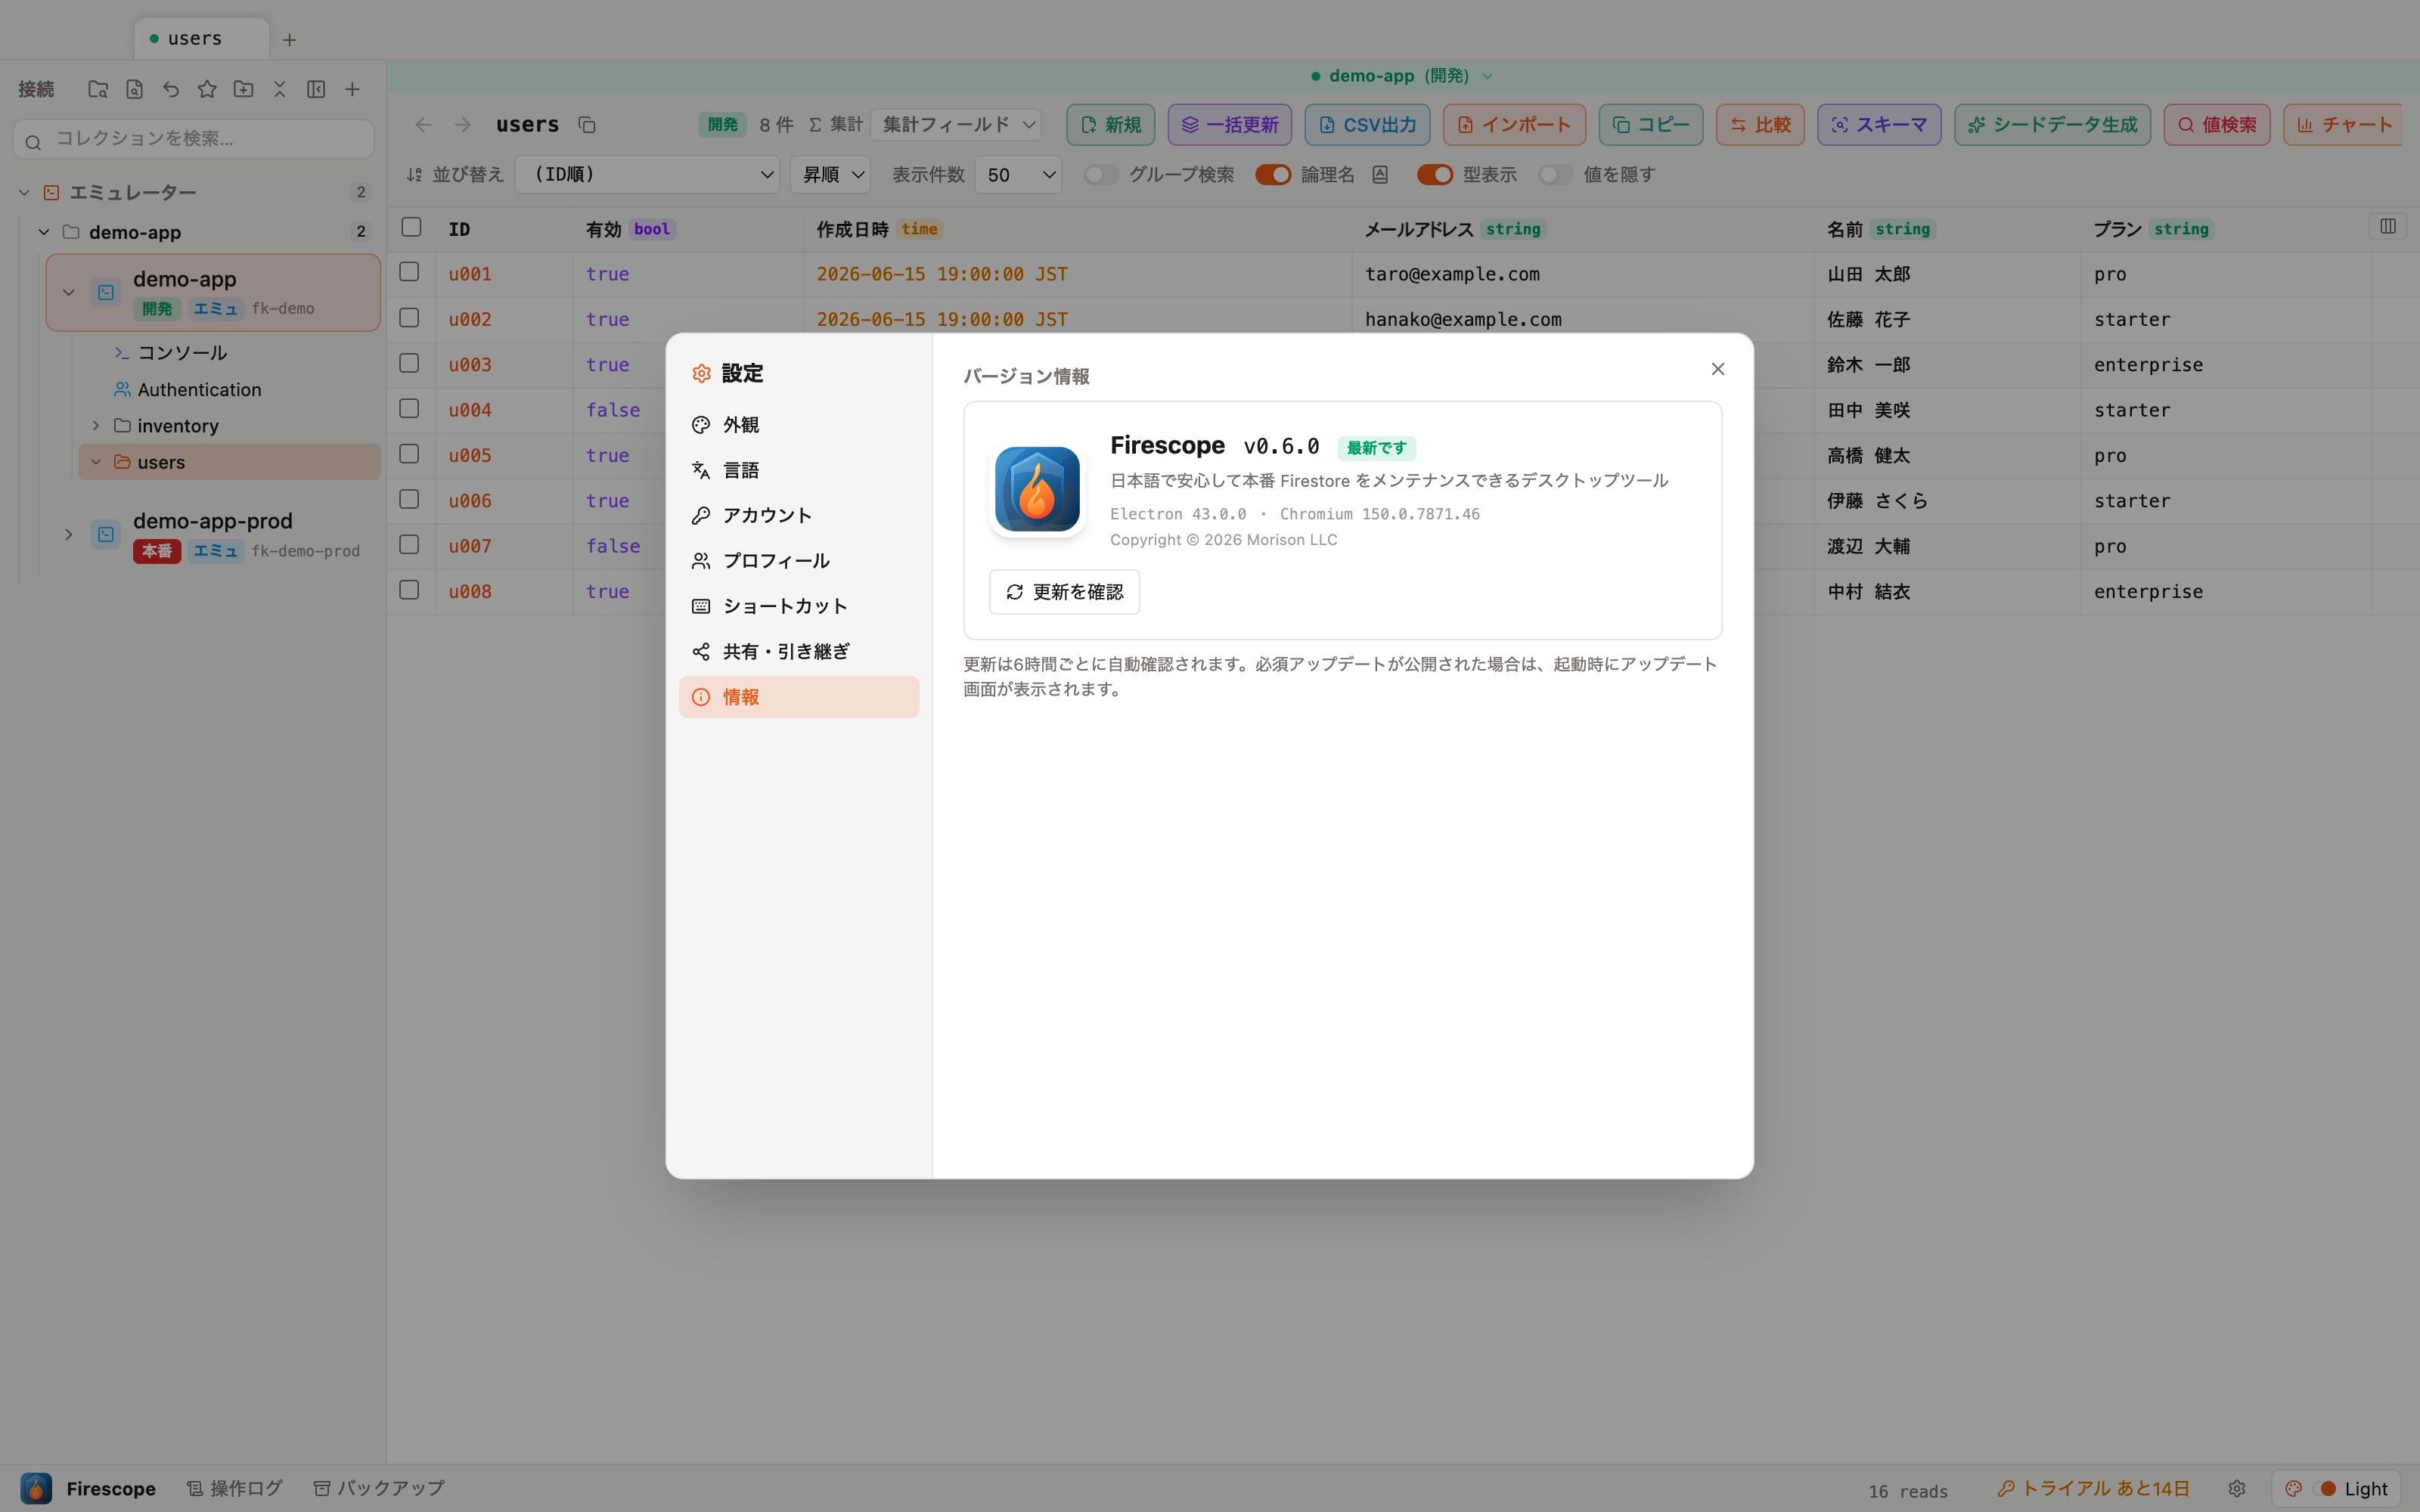
- Updates are checked automatically every 6 hours and at startup (you can also check manually via Settings → About → "Check for updates").
- If a required update is published, the startup update screen handles download → restart → apply automatically — no button presses needed.
- A manual browser download is only suggested if this fails (e.g. while offline).
Pricing and licensing
- All features are available for a 14-day trial from first launch. No sign-up or payment info required.
- After the trial ends, you can still view data for free indefinitely.
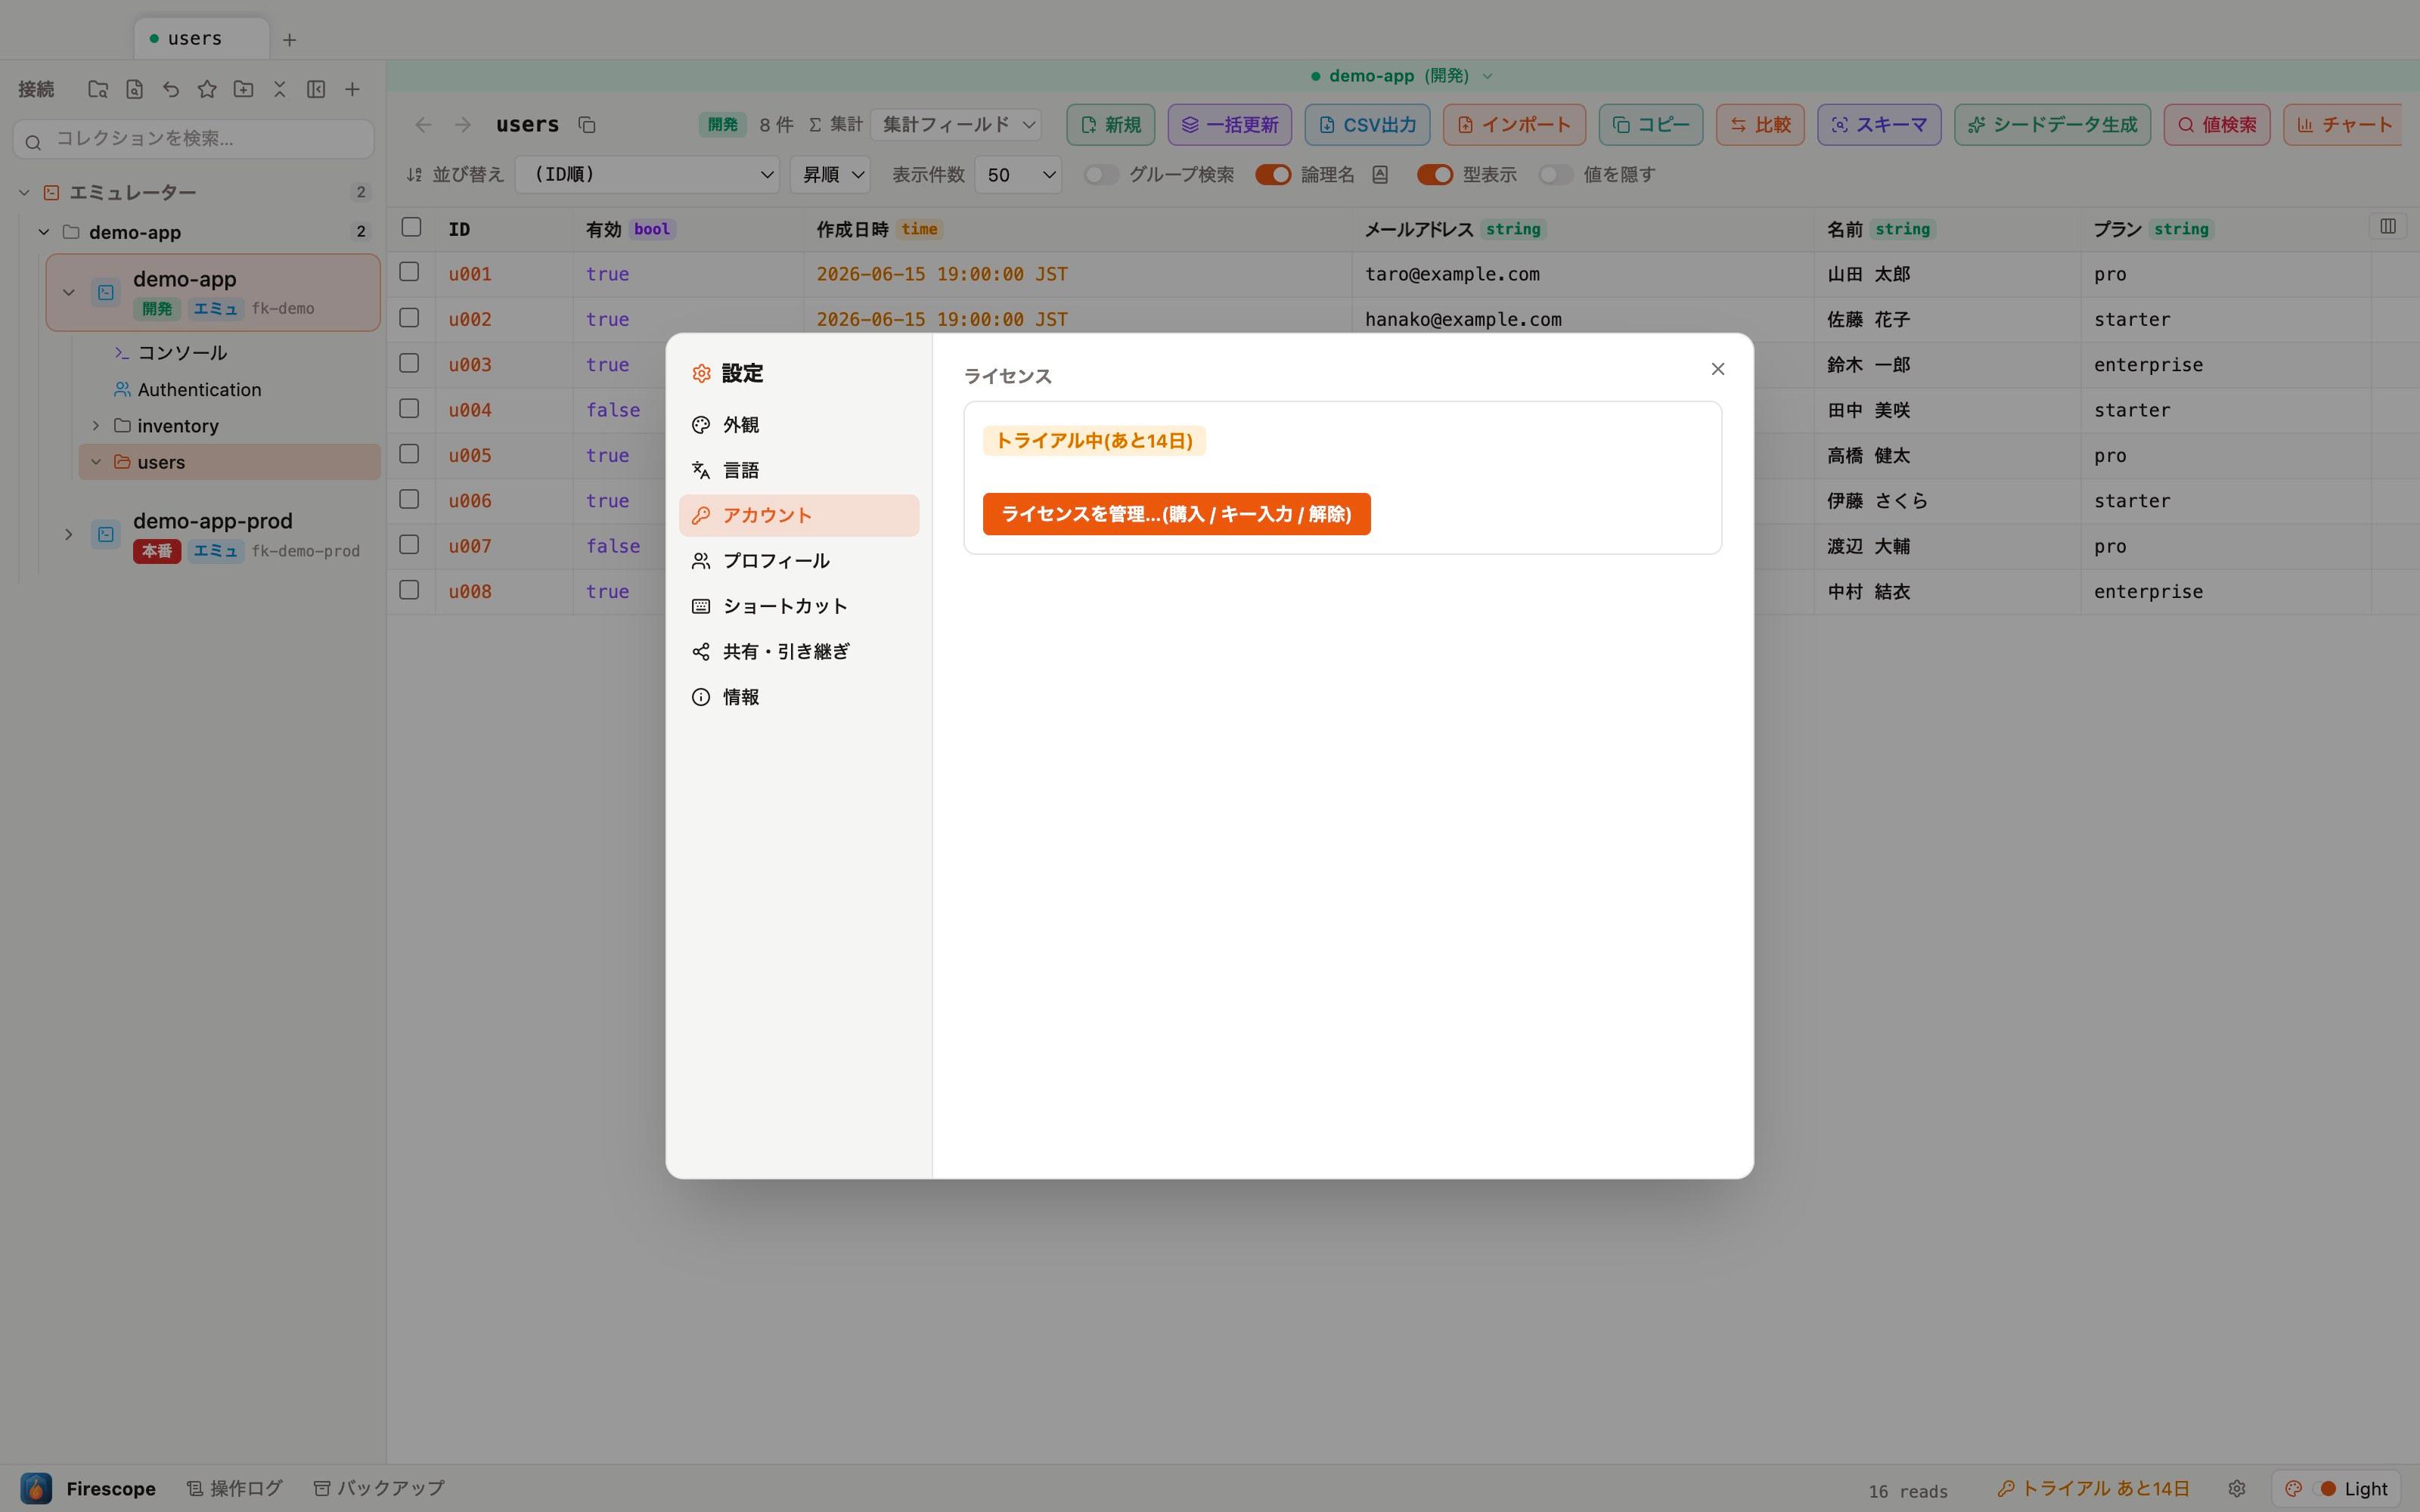
- Purchase from within the app: go to ⚙ Settings → License in the bottom right, choose a plan (Pro / TEAM, monthly / annual), and a Stripe checkout page opens in your browser. Once payment completes, the app activates the license automatically.
- Moving to another Mac? "Deactivate license" on the old machine first, then activate on the new one.
See the pricing page for plan details.
FAQ
- I can't connect / it says "Authentication failed"
- Check that the JSON is a service account key for the target project. If you regenerated the key, disconnect the old connection and reconnect with the new JSON.
- Is any data sent anywhere?
- No. Firescope accesses Firestore directly from your Mac. Neither keys nor data are sent to any external server.
- What does the "production guard" actually do?
- It automatically adjusts confirmation strength based on the connection's environment label and the operation's risk level. For example, deleting a collection in production can't be run without manually typing the project ID. Because this is enforced in the app's core (the main process) rather than as a UI warning, it can't be bypassed by accident.
- Is there a Windows version?
- Yes. Get
Firescope-Setup.exefrom the download page (if SmartScreen warns you, click "More info" → "Run anyway"). - Can I add another language?
- Yes. From Settings → Language, export a language pack (JSON), translate it, and import it back to add any language you like.